
Binance Coin price has dropped by 40% from its highest point this year and is at risk of forming a death cross pattern that will lead to more downside.
Summary
- Binance Coin price has dropped by 40% from the year-to-date high.
- The token has formed a bearish pennant chart on the daily chart.
- It is about to form the risky death cross chart pattern.
The Binance Coin (BNB) token has dropped from its all-time high of $1,376 to the current $840. This plunge has brought its market capitalization to $118 billion, down from the year-to-date high of over $180 billion.
The token has continued to decline due to the ongoing crypto market crash, which has affected Bitcoin and most altcoins.
Binance Coin price technical analysis
The daily chart indicates that the BNB price has been in a pronounced downward trend over the past few weeks. A closer look shows that the token is about to form a death cross pattern, which happens when the 50-day and 200-day Exponential Moving Averages cross each other.
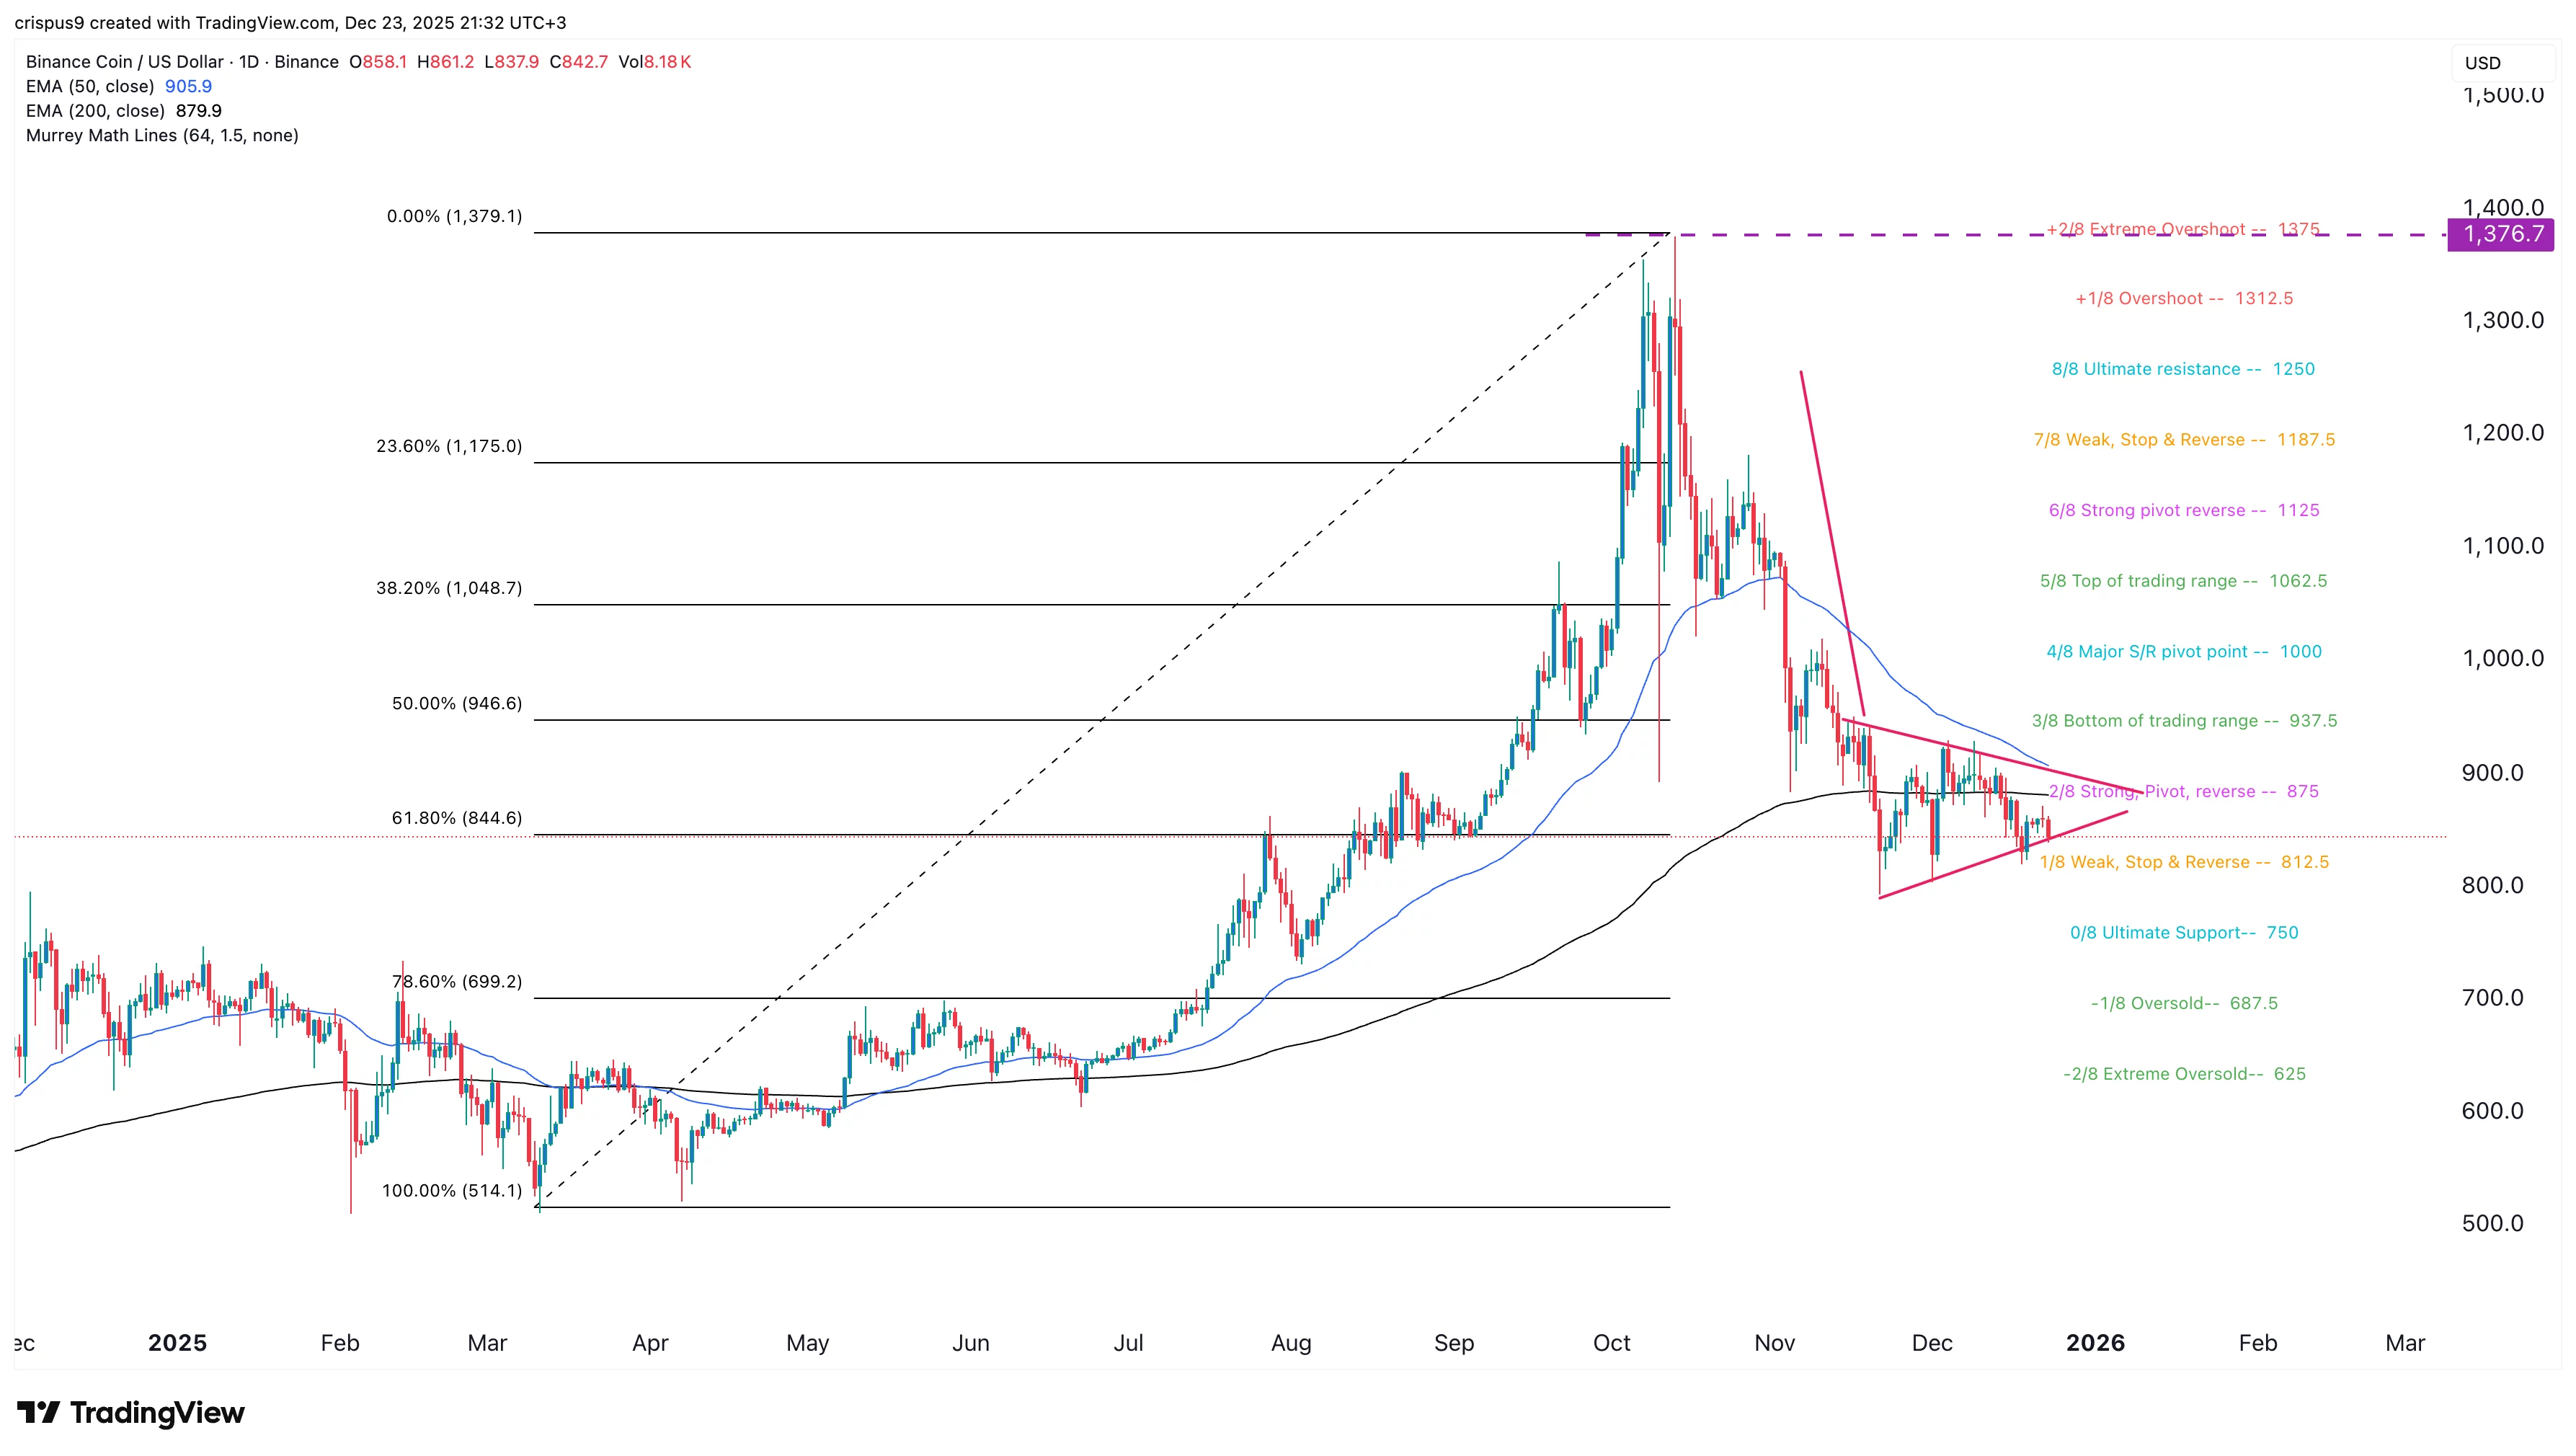
In this case, the 50-day EMA is at $905 while the 200-day EMA has moved to $880, and chances are that the two will cross each other.
At the same time, the token is in the process of forming a bearish pennant pattern, which is made of a straight vertical line and a symmetrical triangle. It is now in the process of forming the triangle pattern whose two lines are about to converge, which will trigger a breakdown.
Binance Coin price has also moved slightly below the 61.8% Fibonacci Retracement level, which is a risky sign because most rebounds normally happen at this level.
BNB price has also moved below the Strong, Pivot, and Reverse levels of the Murrey Math Lines and is now at the Weak, Stop & Reverse point.
Additionally, it remains below the Supertrend indicator and the Ichimoku cloud tool.
Therefore, the token will likely continue falling as sellers target the next key level at $750, the Ultimate Support of the Murrey Math Lines. This target is about 10% below the current level. More downside below that level will lead to further downside to $500.
On the other hand, a move above the 50% Fibonacci Retracement level at $945 will invalidate the bearish outlook and signal more gains ahead, potentially to the all-time high of $1,380.

