
XRP trades near $2 as a bearish EMA ribbon flip returns. Analysts warn of a potential drop, with whales active and ETF inflows still rising.
XRP is trading near $2 after a week of price pressure and mixed technical signals. The token saw a slight dip of over 1% over the last 24 hours and has dropped 4% in the past week. During recent trading, it touched $1.95 before rebounding slightly, forming a short-term support range between $1.95 and $2.05.
Historical Bearish Pattern Returns
Market analyst Steph Is Crypto has shared a recurring pattern on XRP’s 3-day chart. According to the analysis, every time the EMA ribbon flips to a bearish setup and price remains under it, the asset has entered a long downward phase. Past declines have ranged between 27% and 66%, often lasting several months. The signal has occurred multiple times over the years, including notable drops in 2014, 2019, and 2022.
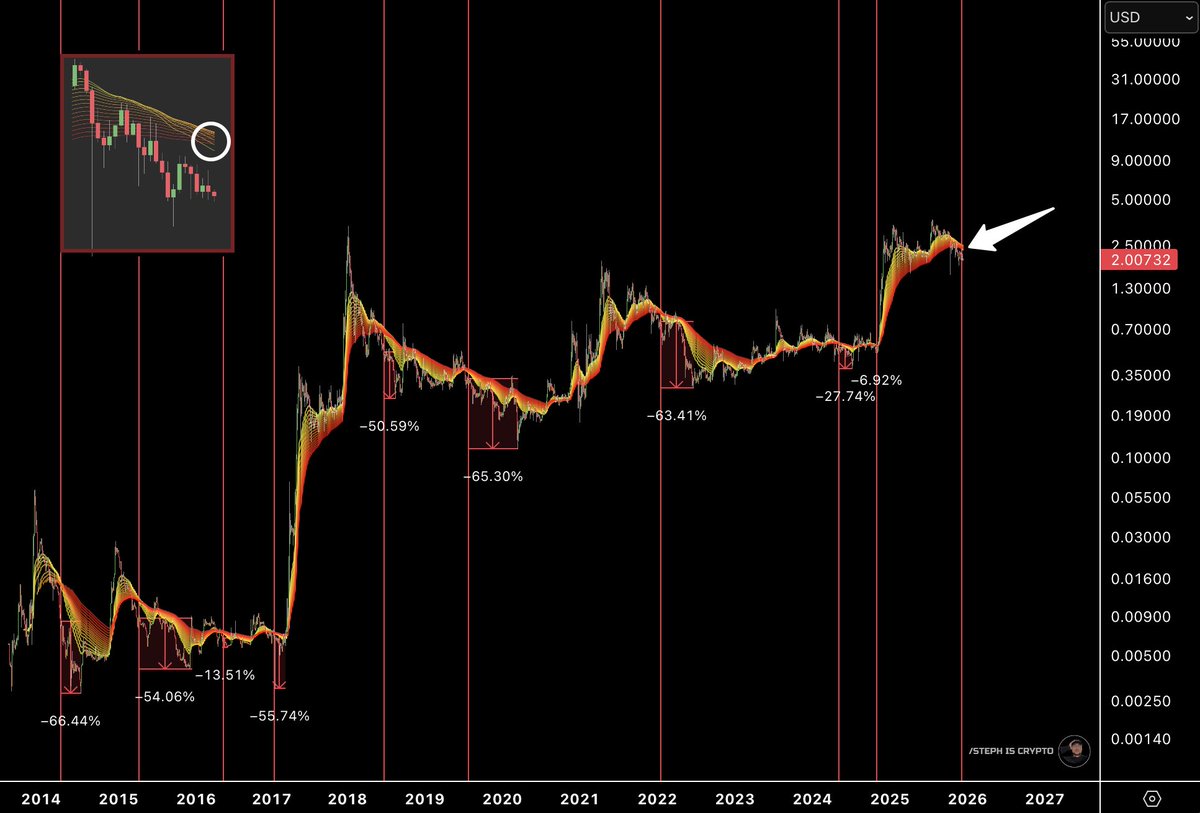
XRP has once again moved below the EMA ribbon, triggering the same setup. Based on the chart, the ribbon has flipped bearish, and the price has yet to reclaim it. If the pattern holds, XRP may be facing another extended period of downside.
“So far, this signal has no exceptions,” the analyst said.
CRYPTOWZRD shared an update on XRP’s daily chart, noting that the latest daily candle closed slightly bearish. The weekly chart remains undecided. The $2.1 level is now acting as short-term resistance. A clear break above this could shift momentum. If the price fails at this level, it may invite more selling.
On the intraday chart, XRP has shown signs of a pullback after recent volatility. A move to $2.1 followed by weakness could trigger short setups. If the price holds above this level, the structure may begin to shift toward a more bullish stance.
Sideways Range Holds Structure
ChartNerd posted that XRP remains inside a 13-month trading range, which stretches from just below $2 up to a resistance zone slightly above $3.00. The asset is currently near the lower boundary but has not broken below it.
There is no change in the broader structure, as long as XRP remains inside this range. The recent movement is part of an extended sideways phase, and the market has yet to commit to a clear direction.
You may also like:
Meanwhile, Ali Martinez also pointed out a TD Sequential buy signal on XRP, but warned,
“Everything hinges on $1.90. Hold it, and $2.50 comes into play.”
Whales Active as ETF Demand Builds
As CryptoPotato reported, data shows increased trading activity from large accounts, even as XRP trades near yearly lows. The firm noted a shift in taker volume demand, which it said is common during bottoming periods.
In addition, U.S.-listed XRP spot ETFs have seen steady interest. Since launching on November 13, they have recorded 30 days of net inflows. SoSoValue reports that total net assets stand at around $1.18 billion, with approximately $991 million in net inflows. These funds continue to grow, even as other crypto ETFs report outflows.
SECRET PARTNERSHIP BONUS for CryptoPotato readers: Use this link to register and unlock $1,500 in exclusive BingX Exchange rewards (limited time offer).

