XRP just posted its biggest weekly rally in months, surging nearly 80% from April lows to hit a five-month high on Friday. The rally mirrors broader strength across the crypto market, as investors pile into risk assets amid fresh regulatory momentum and a record-breaking run for Bitcoin.
The Ripple (XRP) token jumped as high as $2.9695 on July 11, its highest level since March 2, driven by three key factors: Bitcoin’s (BTC) surge to an all-time high of $118,300, accelerating inflows into the new leveraged XRP exchange traded fund, or ETF, and renewed investor optimism following Ripple CEO Brad Garlinghouse’s appearance in Washington ahead of the proposed CLARITY Act.
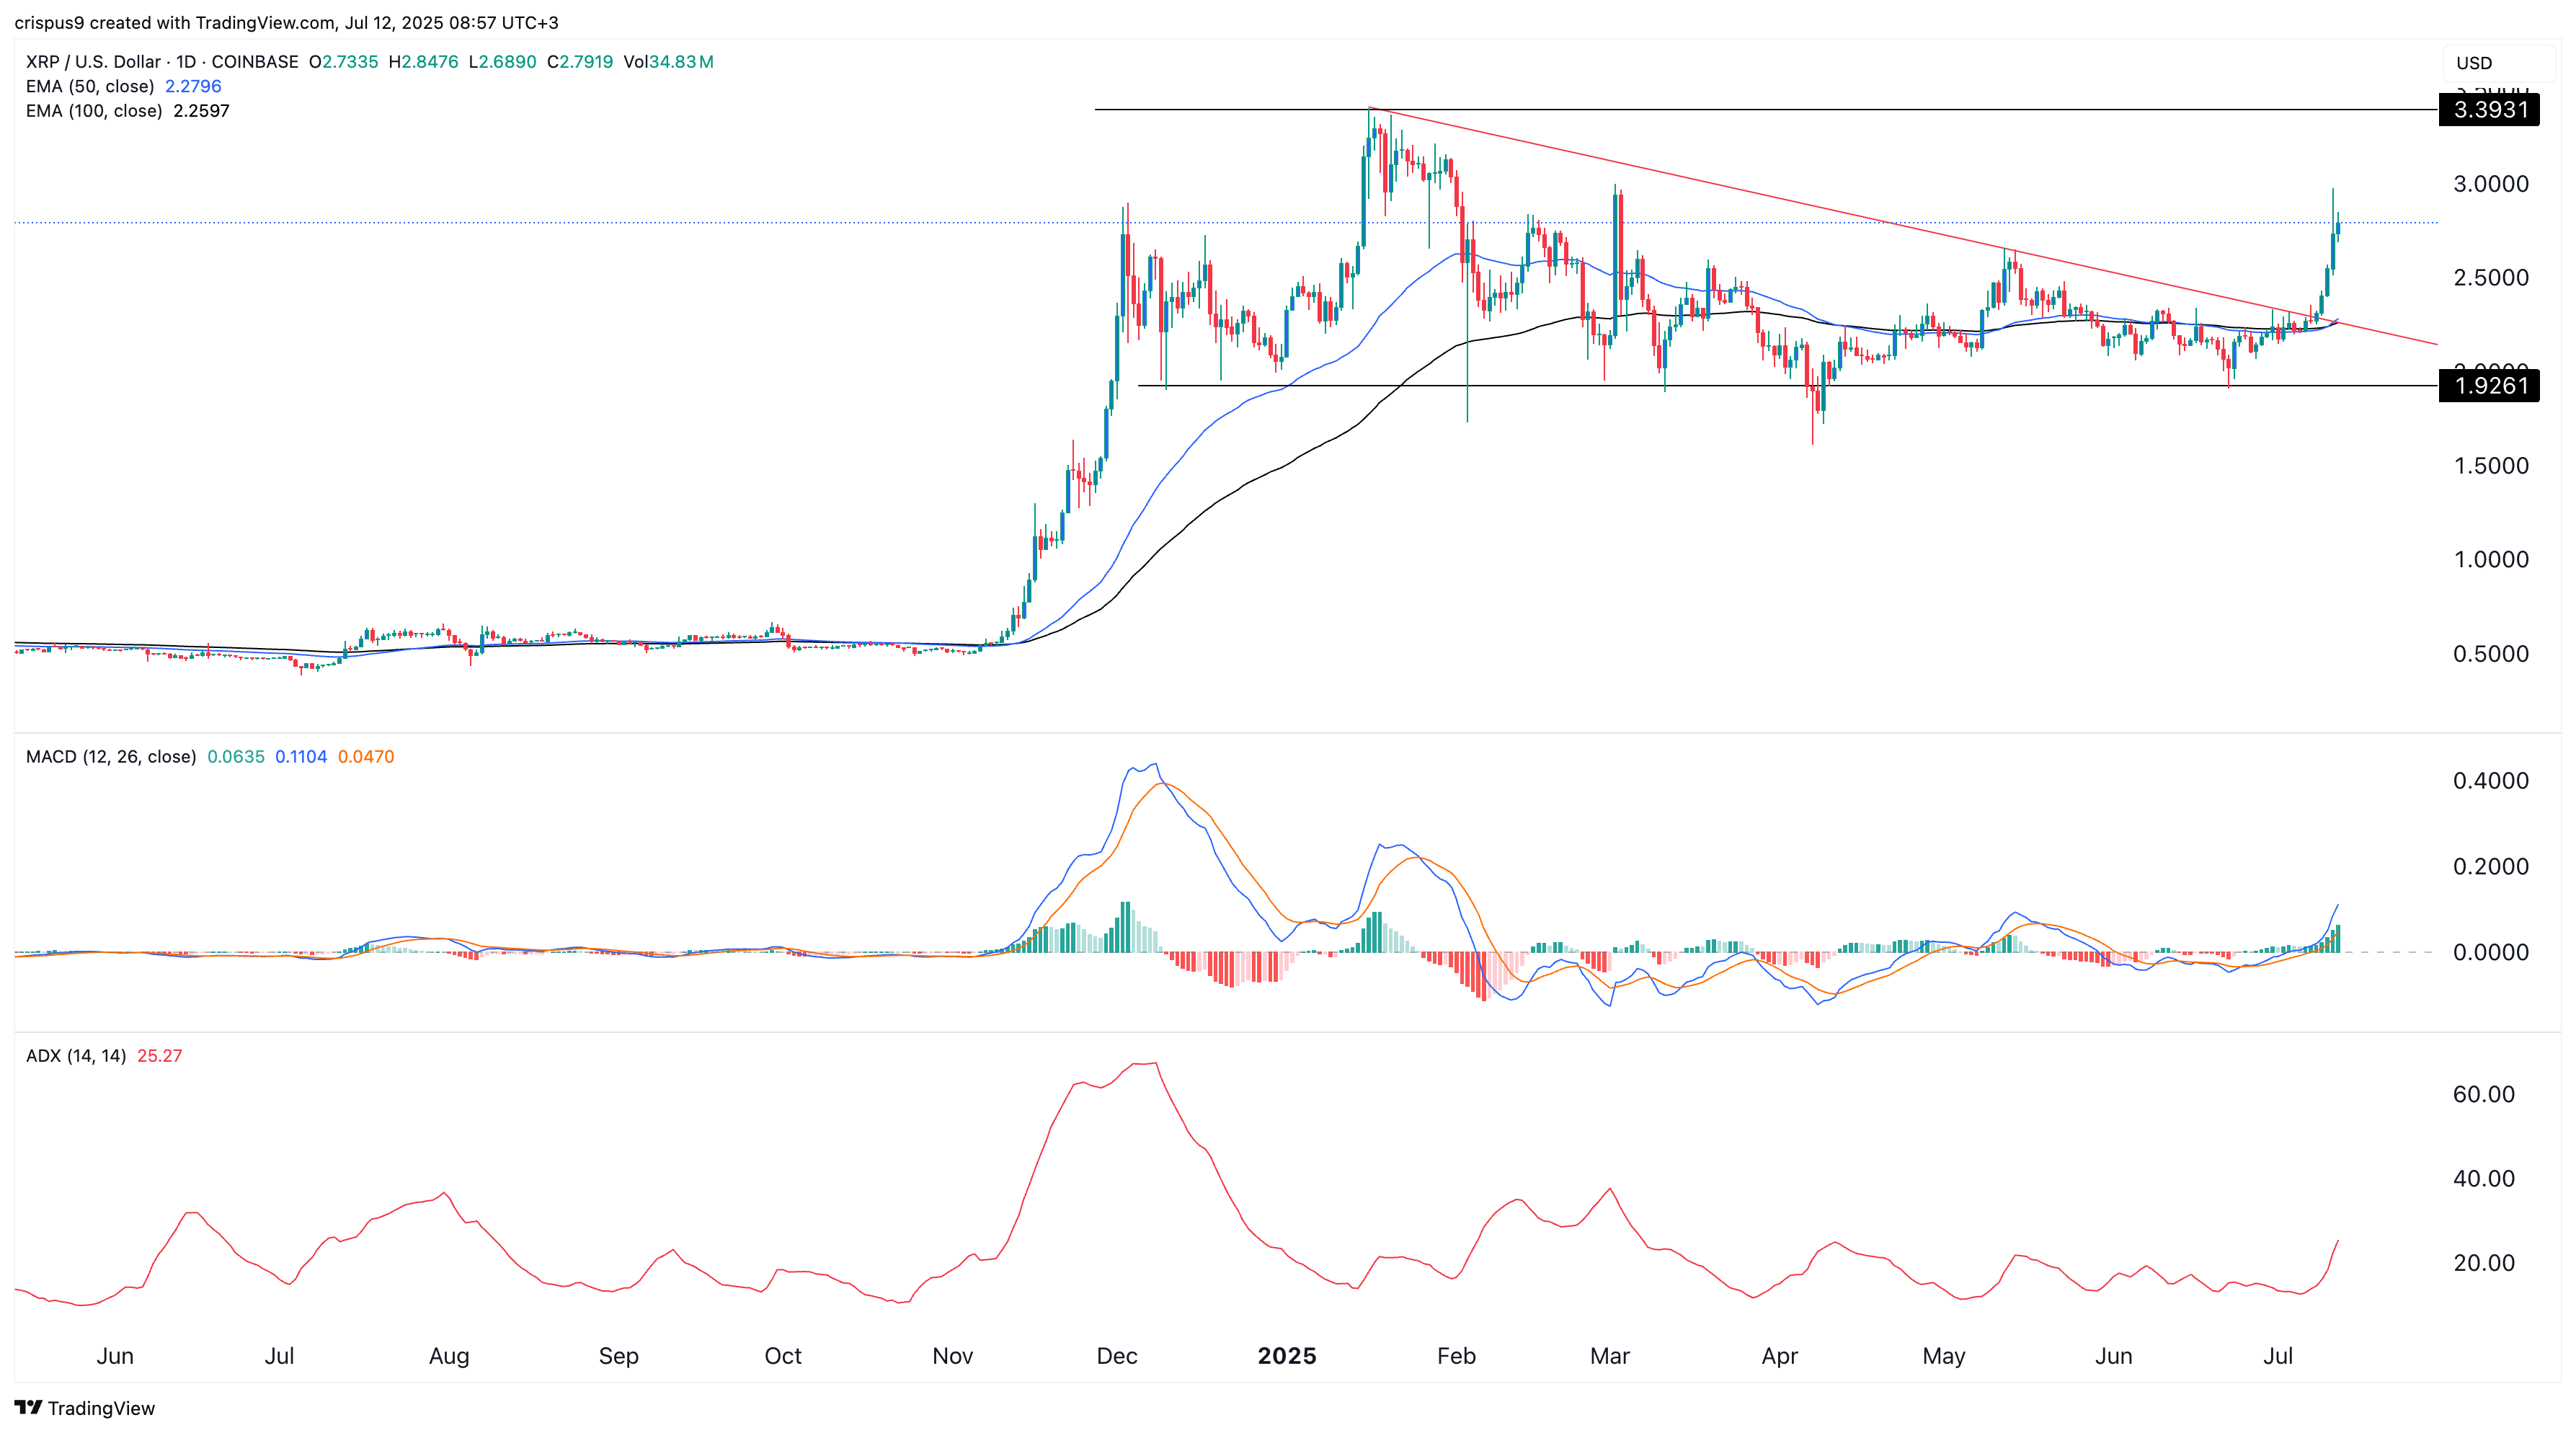
Combined with bullish technical signals—including a breakout from a months-long triangle pattern—the rally has traders eyeing a return to the coin’s year-to-date peak of $3.3930.
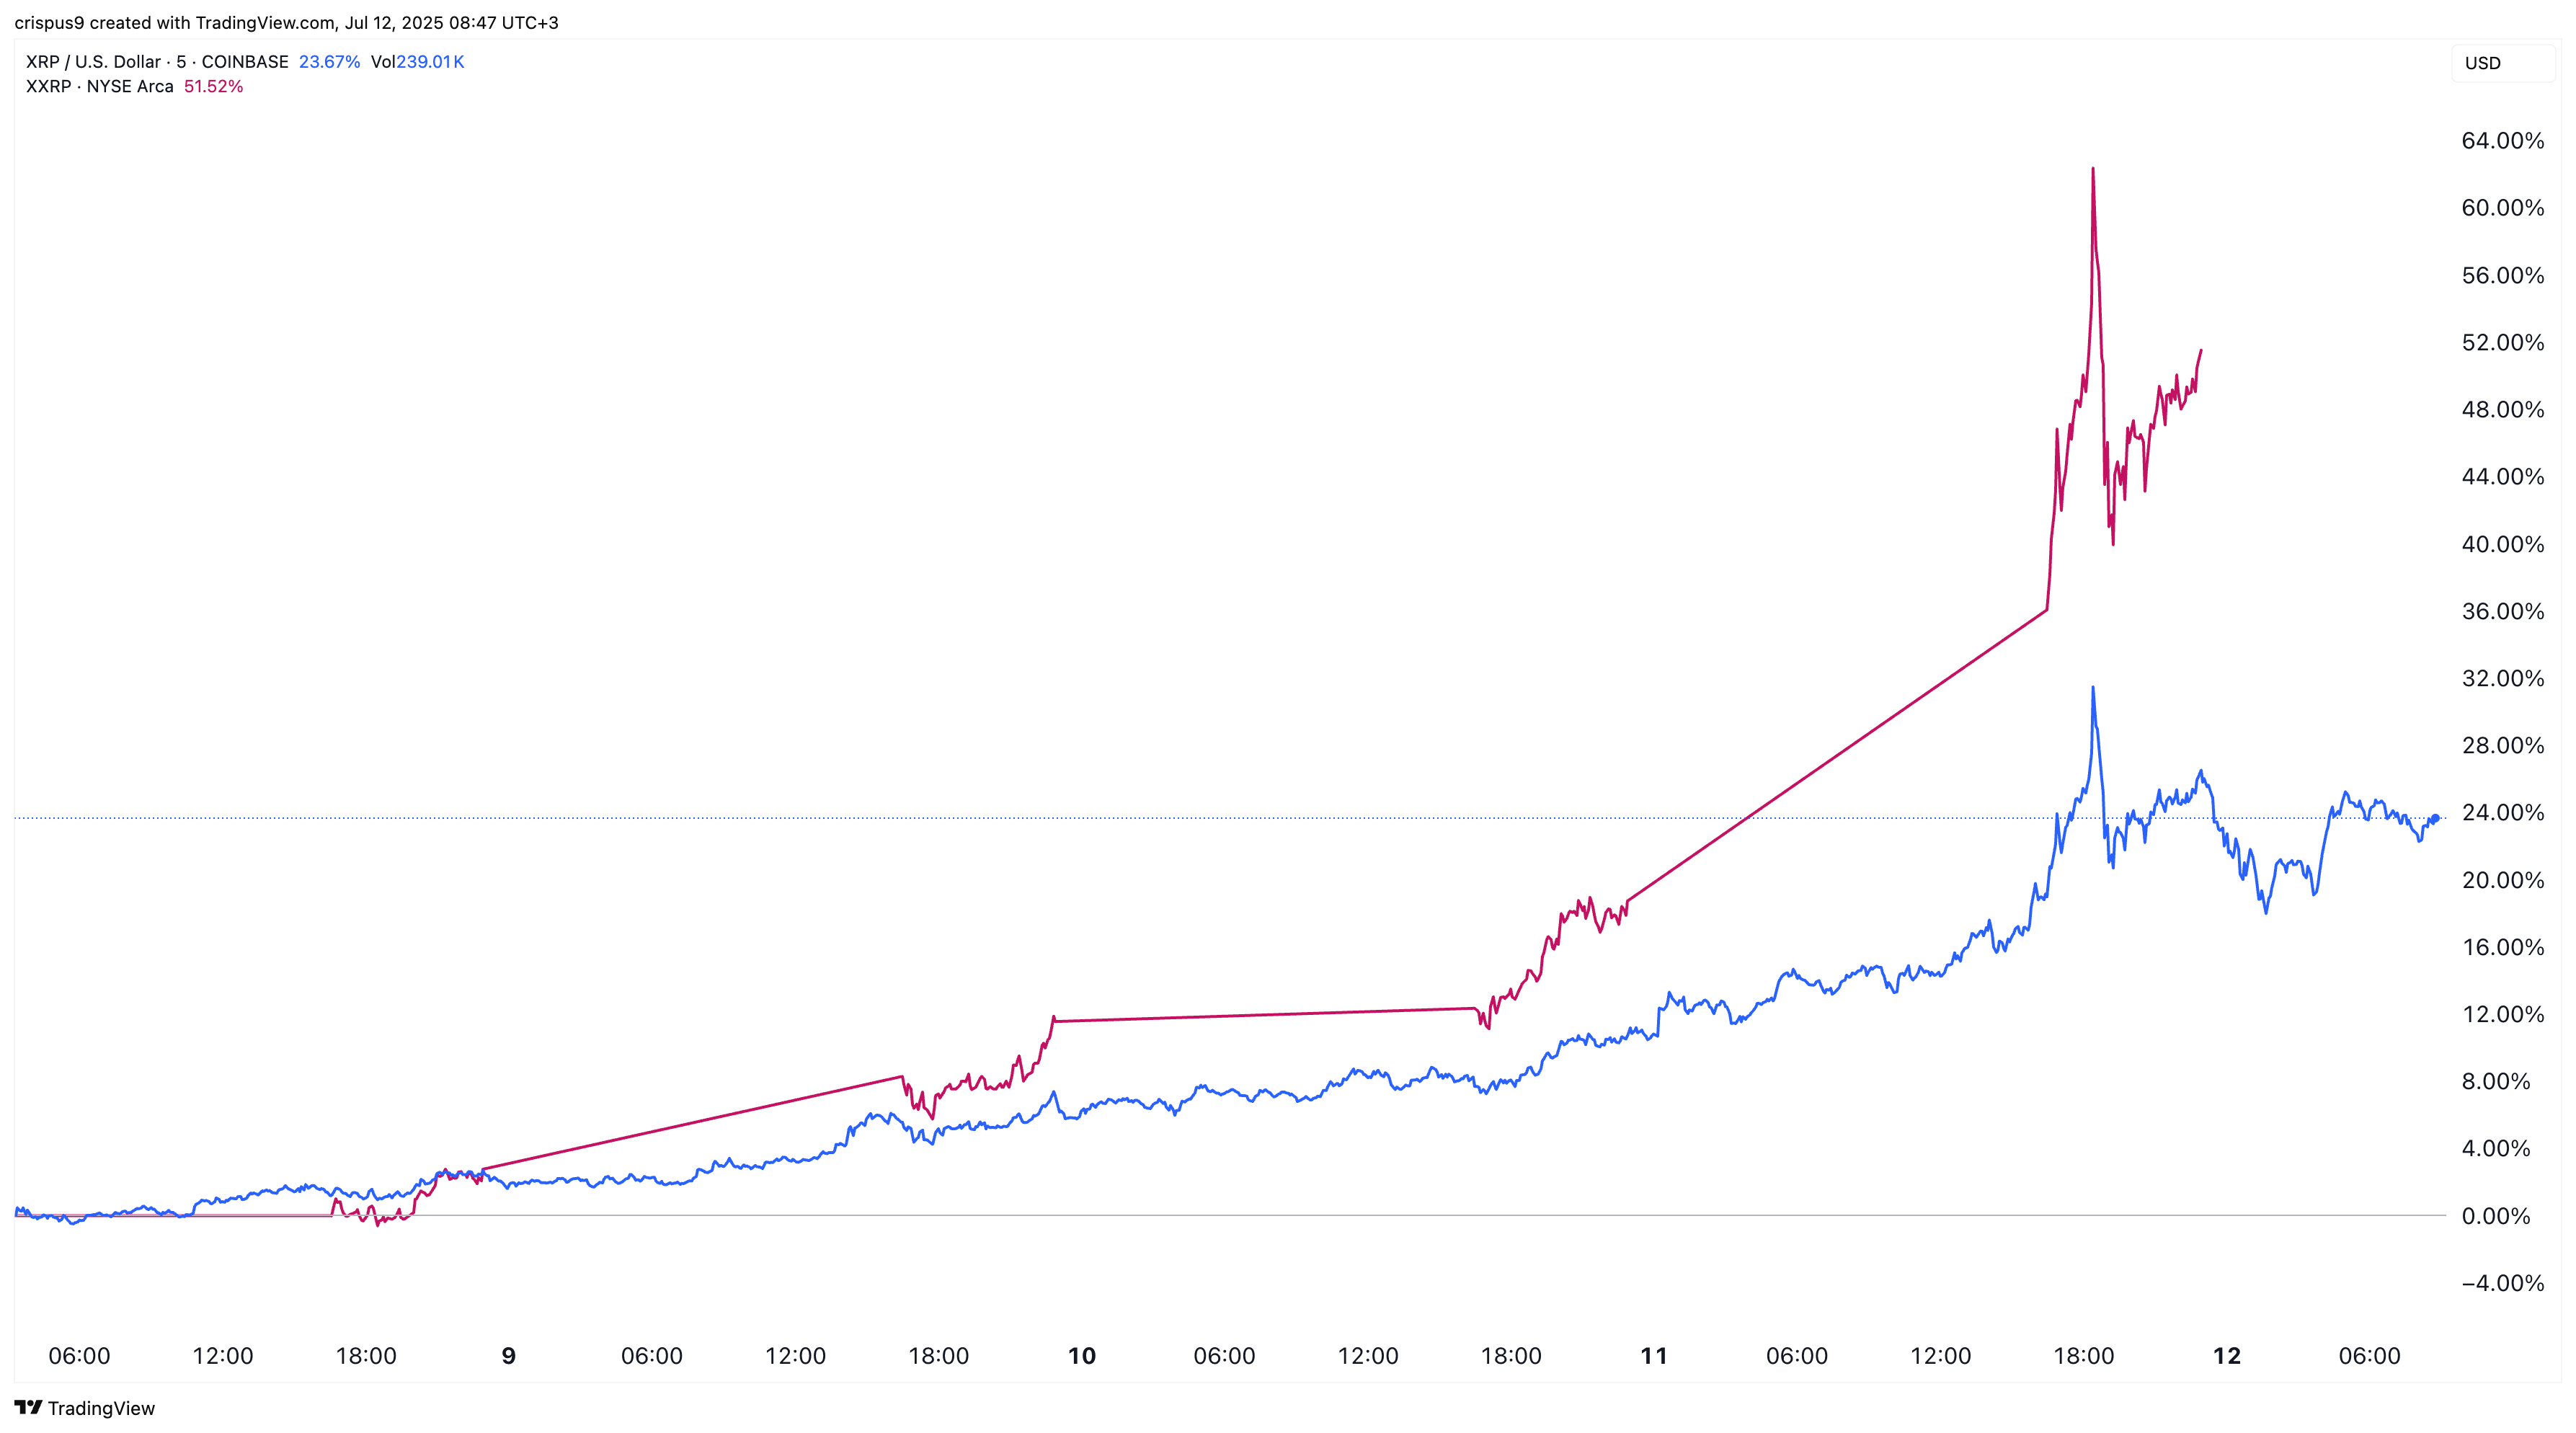
The recently launched Teucrium 2X Long Daily XRP ETF (XXRP) continued to attract investors, with its assets increasing to $248 million. It has experienced inflows in every week since its launch in April, and its daily volume has increased significantly.
The ongoing inflows surge into XXRP is notable because of its costs. Unlike most ETFs, which have an expense ratio of less than 0.50%, the fund’s ratio stands at 1.89%. This means that a $10,000 investment costs about $189.
The XXRP ETF aims to compensate for the high fees by offering twice the daily return of Ripple’s price. For example, XRP price jumped by 24% in the last five days, while the XXRP stock jumped by 51% in the same period.

The price also reacted to Garlinghouse’s presentation in Washington, where politicians held a hearing on the upcoming CLARITY Act. CLARITY, a bill under consideration during the upcoming Crypto Week, aims to separate crypto roles between the Securities and Exchange Commission and the Commodity Futures Trading Commission.
XRP price technical analysis

The daily chart shows that Ripple’s token price staged a strong rally this week, moving above the descending trendline that connects the highest swings since January. It was the upper side of the triangle pattern.
The 50-day and 100-day Exponential Moving Averages have formed a bullish crossover. Additionally, the Average Directional Index has risen to 25, indicating that the trend is strengthening.
Therefore, the most likely scenario is one where the coin continues to rise, with the next key target being the year-to-date high of $3.3930.


