
Ethereum is currently testing a decisive resistance region near the 200-day moving average at $2.5K, which has triggered a consolidation phase.
While a deeper short-term correction remains possible due to prevailing supply and overbought conditions, market structure and momentum suggest a potential bullish breakout in the mid-term.
Technical Analysis
By ShayanMarkets
The Daily Chart
ETH’s recent bullish momentum has pushed the price toward the critical $2.5K resistance zone, which aligns with the 200-day moving average—a historically significant level of supply and market reaction. Upon testing this confluence of resistance, Ethereum has lost its upward momentum, entering a temporary consolidation phase.
A decisive breakout above this psychological barrier and the 200-day MA would signal a shift in market sentiment, potentially marking the beginning of a broader bullish reversal. Such a move could propel the price toward the $3K threshold in the mid-term.
However, the presence of a resting supply at this level, combined with the RSI indicator showing overbought conditions, increases the likelihood of a short-term corrective move. A continued consolidation within the $2.1K–$2.5K range remains plausible, offering the market time to reset before another breakout attempt.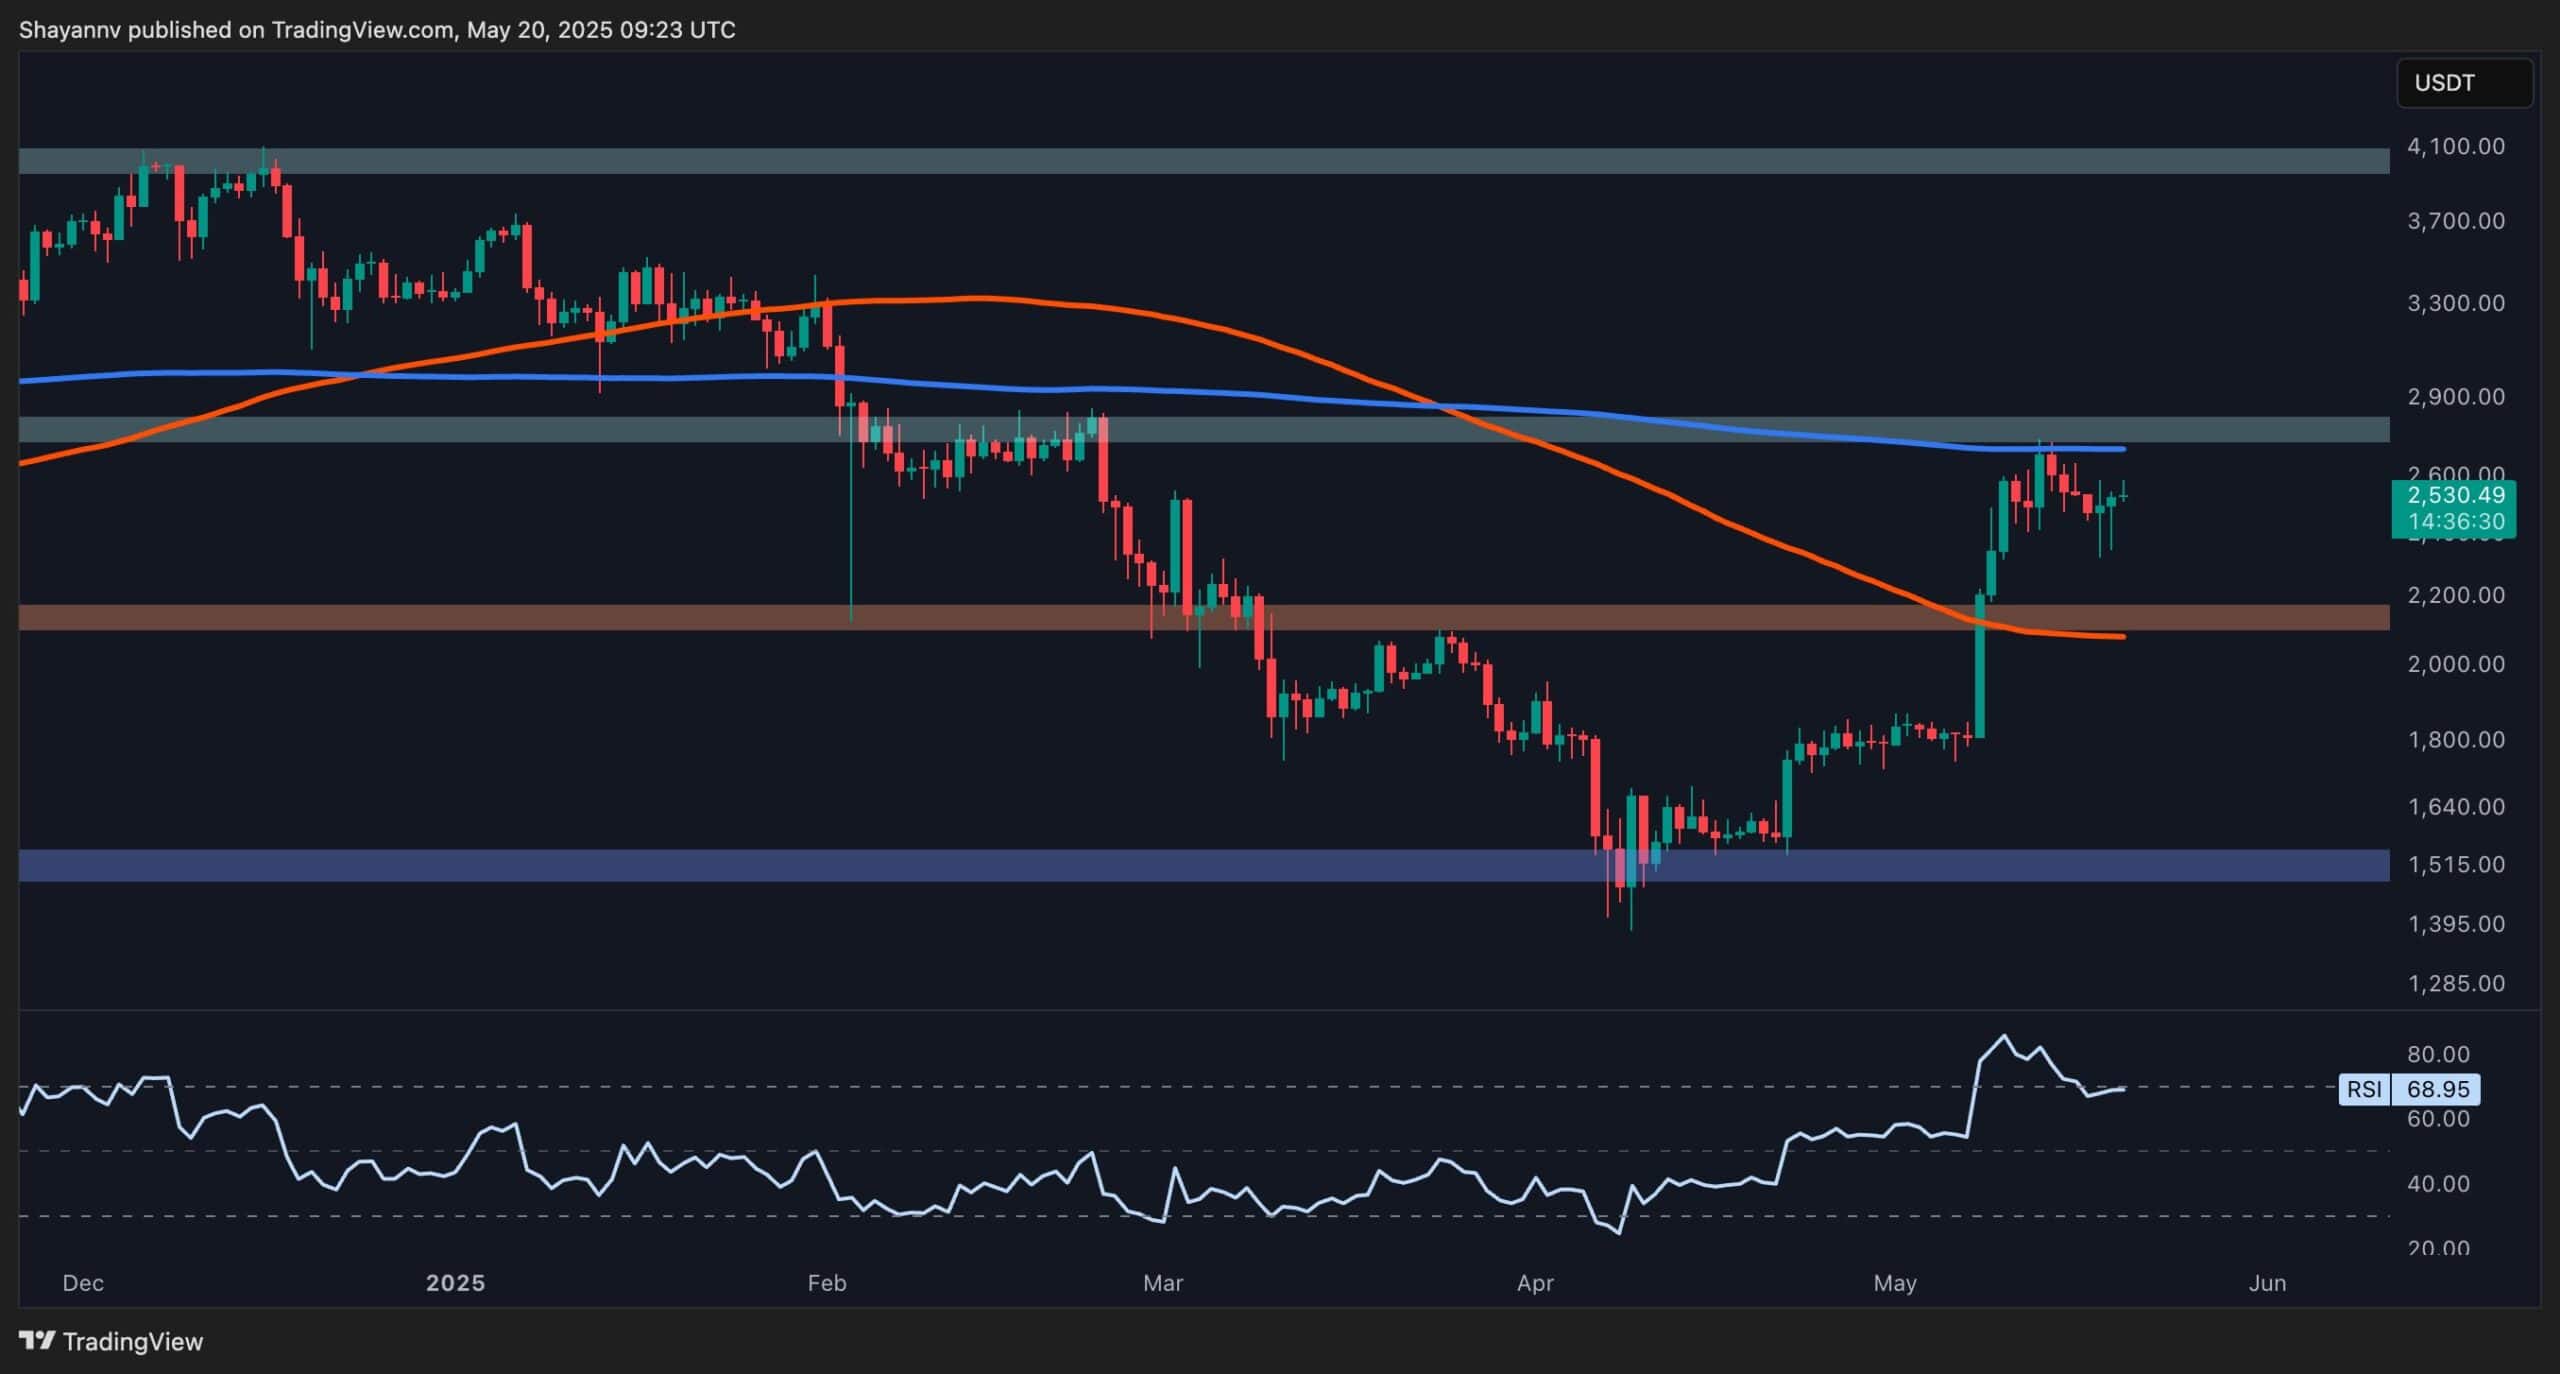
The 4-Hour Chart
In the 4-hour timeframe, Ethereum’s rally has visibly stalled at the $2.5K mark, with signs of distribution and selling pressure becoming apparent. This consolidation has formed a bullish continuation wedge—an often reliable pattern suggesting a temporary pause before a potential breakout.
If the wedge’s lower boundary successfully holds, Ethereum could soon initiate a bullish breakout, reclaiming momentum and potentially breaching the $2.5K resistance zone. Conversely, a breakdown below this pattern would indicate a deeper correction, likely driving the price toward the key support level of $2.1K.
In summary, ETH remains in a state of consolidation under a major resistance level. Traders should closely monitor the wedge structure and the $2.1K–$2.5K range for clues on the next significant move.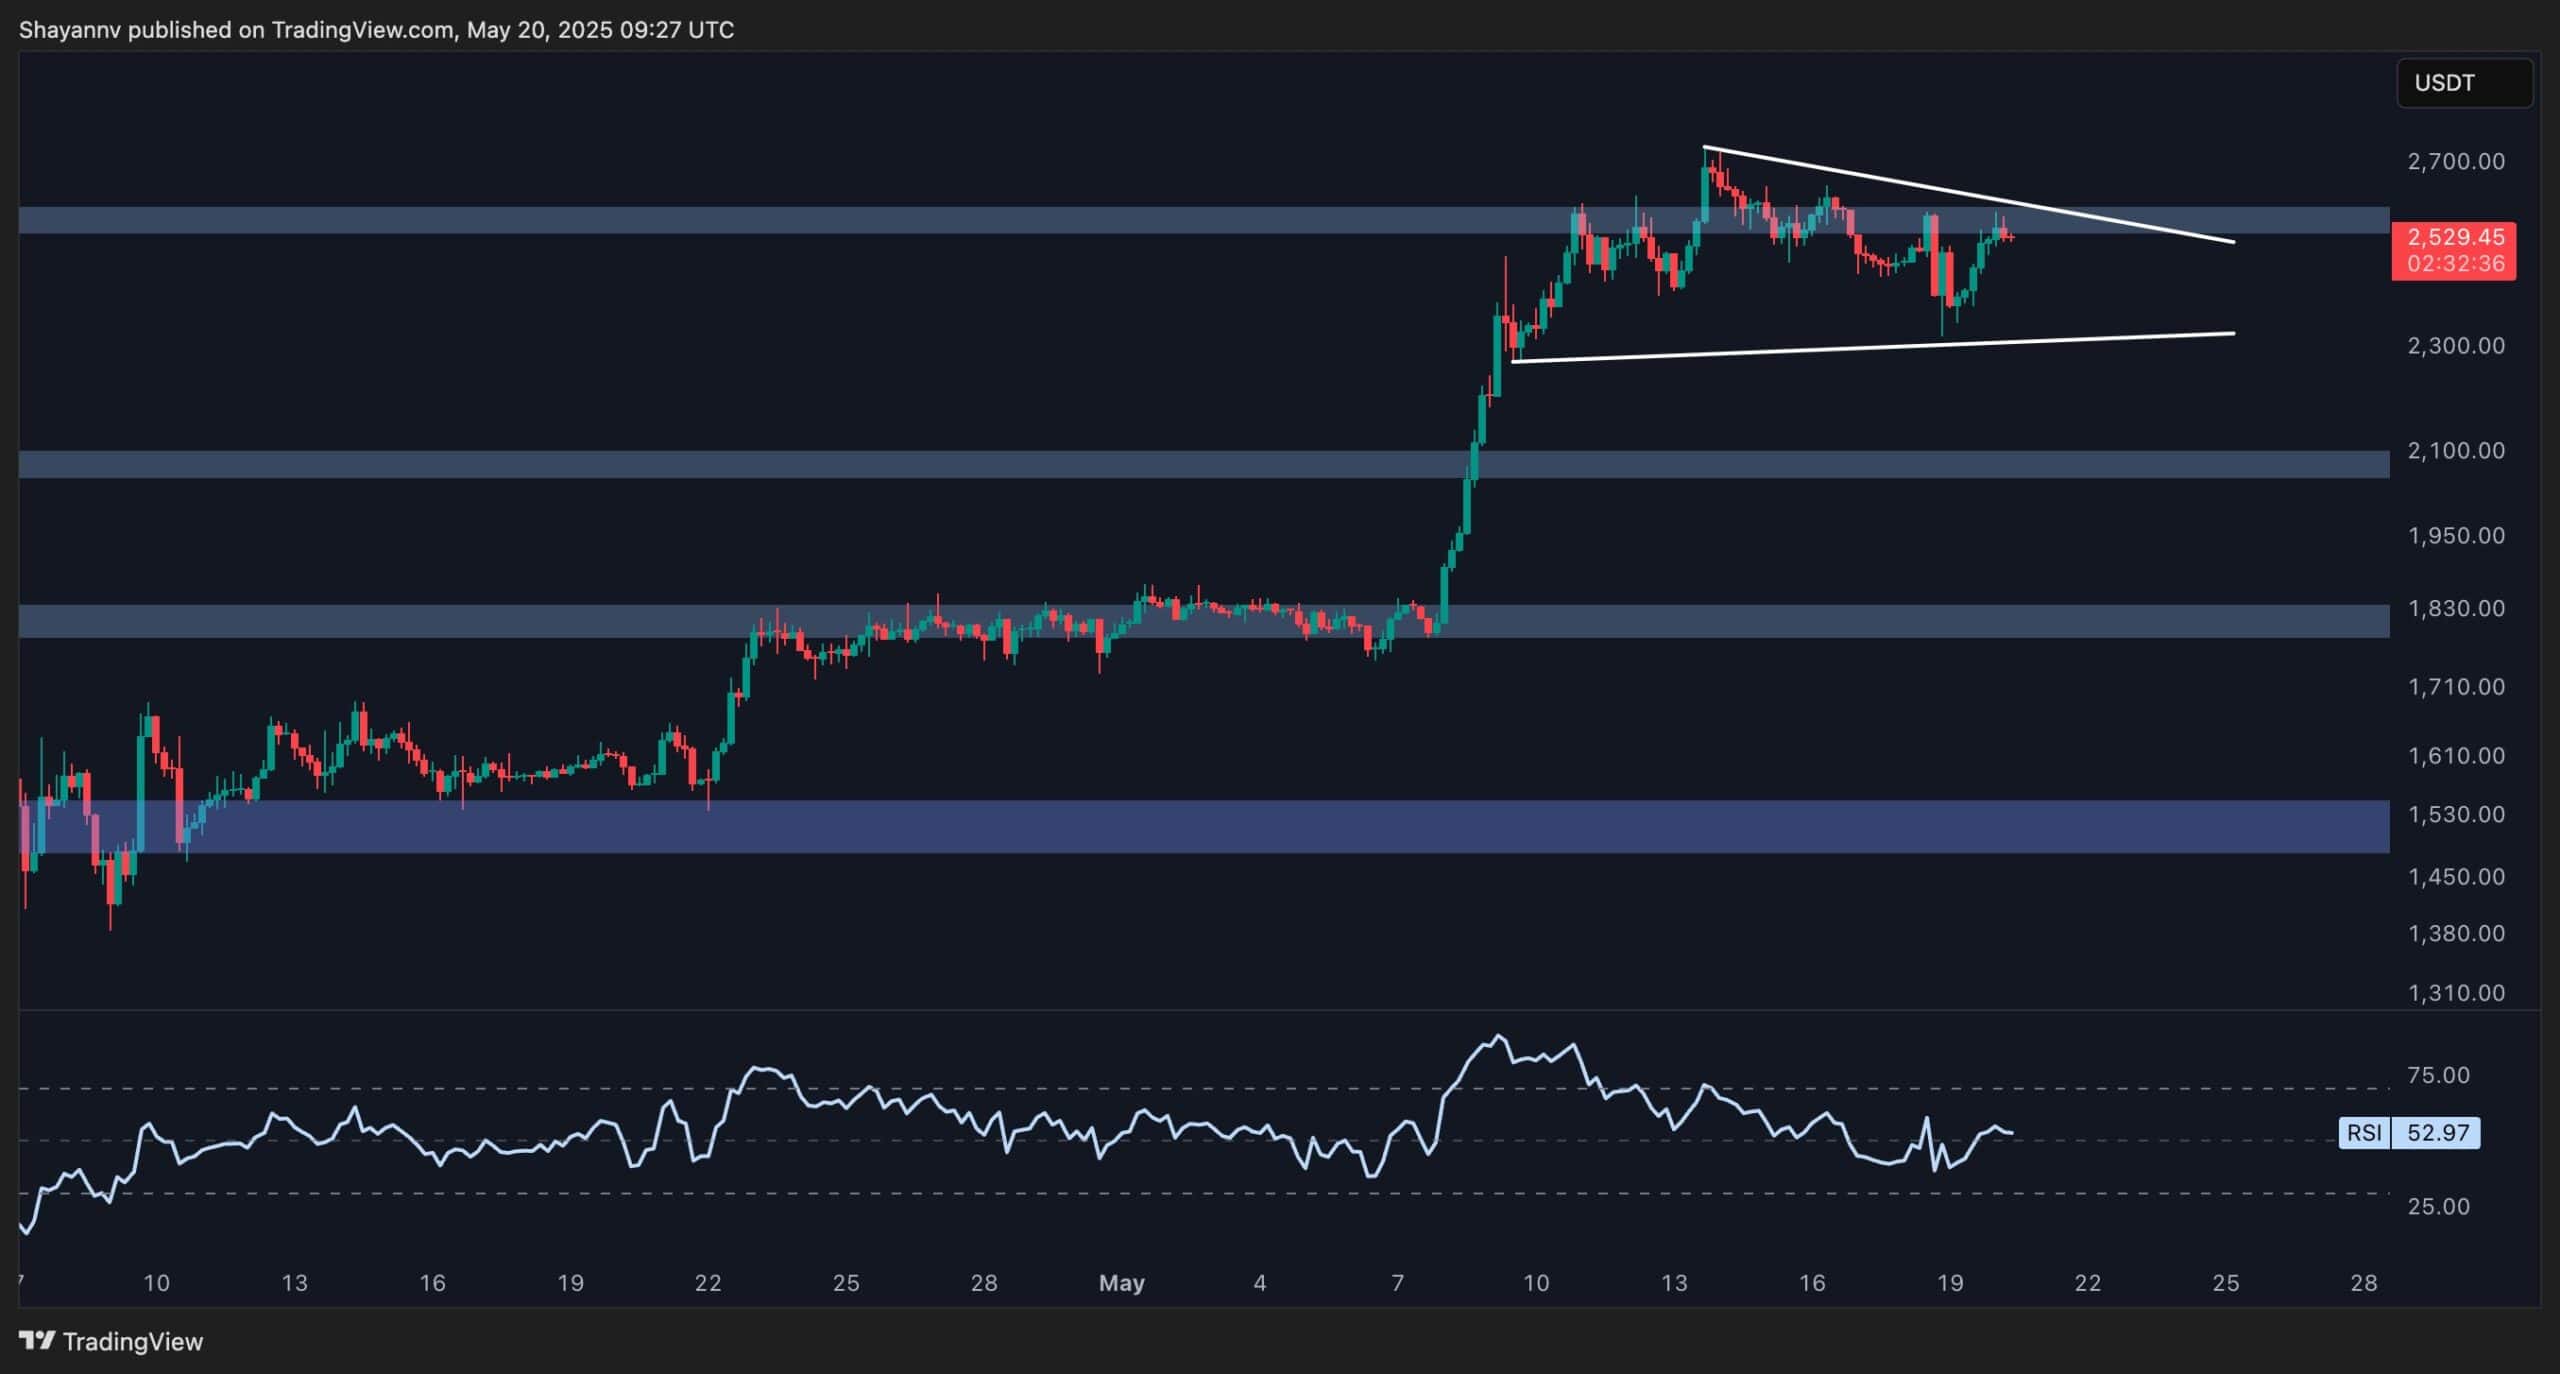
Onchain Analysis
The bubble chart below illustrates total trading volume across all exchanges, where bubble size reflects volume magnitude and colour indicates the rate of volume change, categorized as Cooling, Neutral, Overheating, and Highly Overheating.
As shown, Ethereum’s approach to the critical $2.5K resistance level has led to an overheating state, characterized by a significant surge in trading volume. This spike is primarily driven by profit-taking activity and the presence of resting supply at this psychologically significant price zone. The overheated condition points to a likely short-term correction as the market cools down, paving the way for renewed accumulation.
Consequently, Ethereum is expected to continue its consolidation phase until fresh demand emerges to drive a breakout above this resistance range in the mid-term.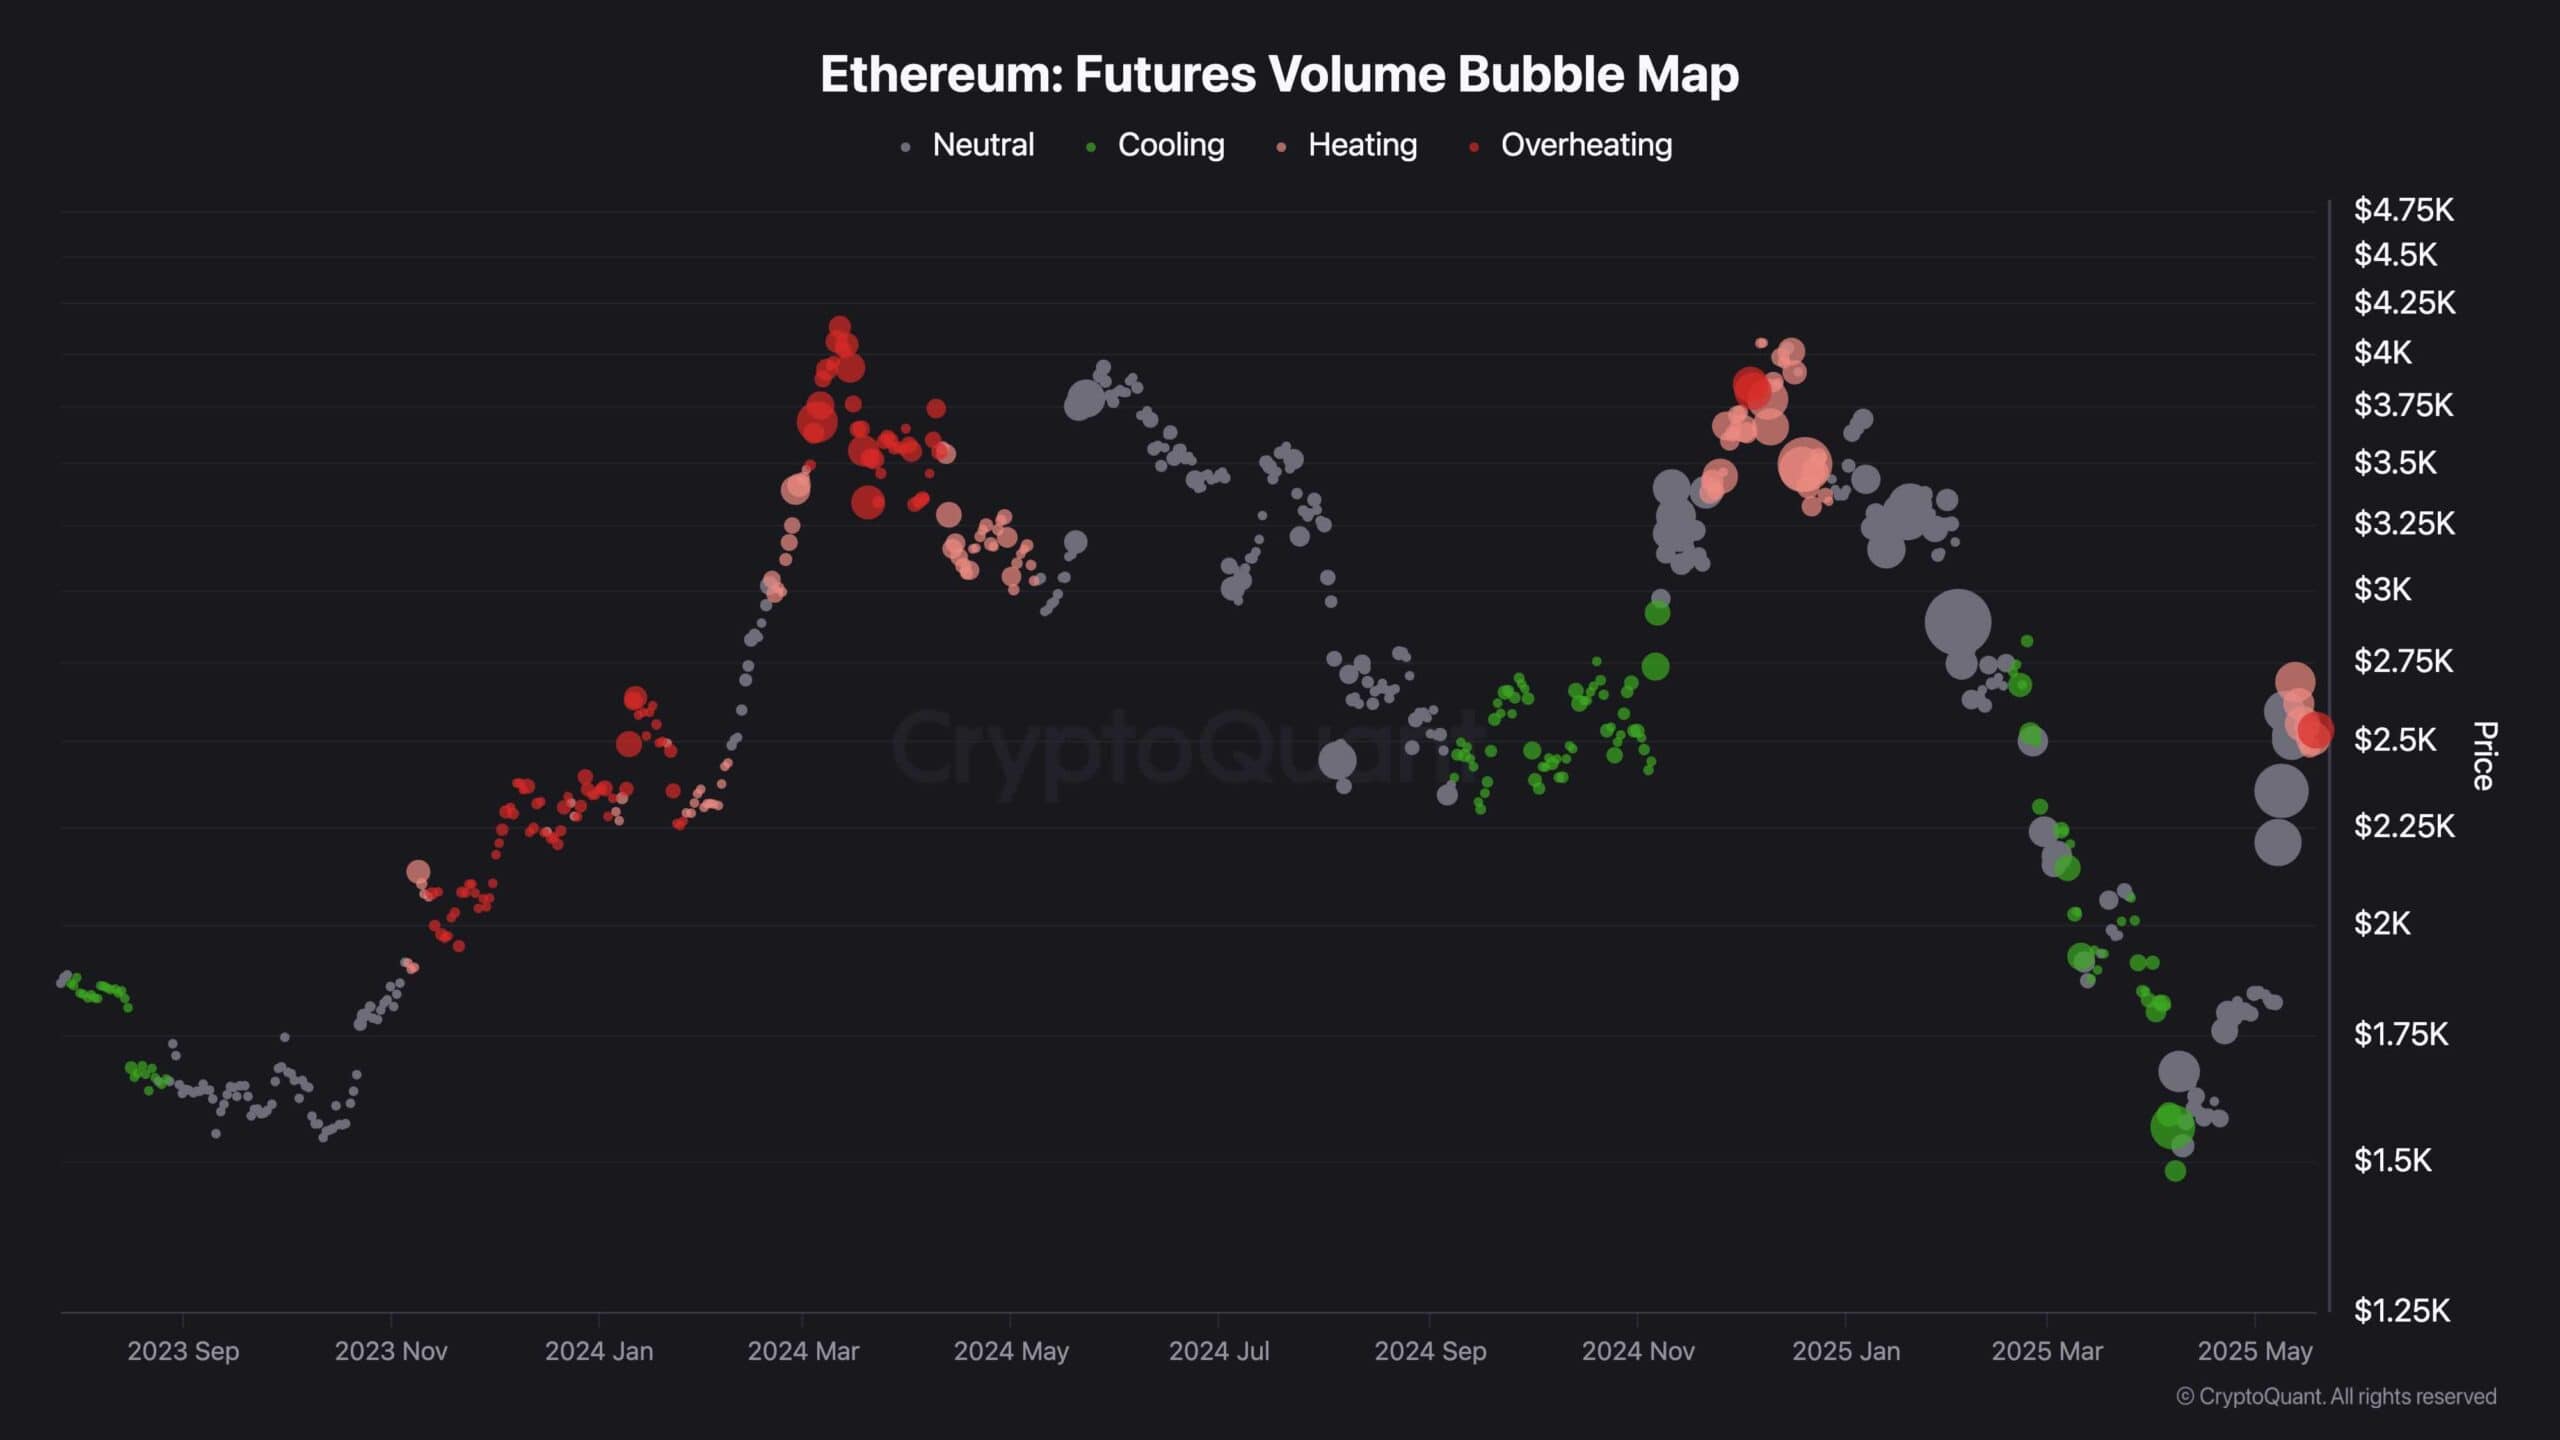
Binance Free $600 (CryptoPotato Exclusive): Use this link to register a new account and receive $600 exclusive welcome offer on Binance (full details).
LIMITED OFFER for CryptoPotato readers at Bybit: Use this link to register and open a $500 FREE position on any coin!
Disclaimer: Information found on CryptoPotato is those of writers quoted. It does not represent the opinions of CryptoPotato on whether to buy, sell, or hold any investments. You are advised to conduct your own research before making any investment decisions. Use provided information at your own risk. See Disclaimer for more information.
Cryptocurrency charts by TradingView.

