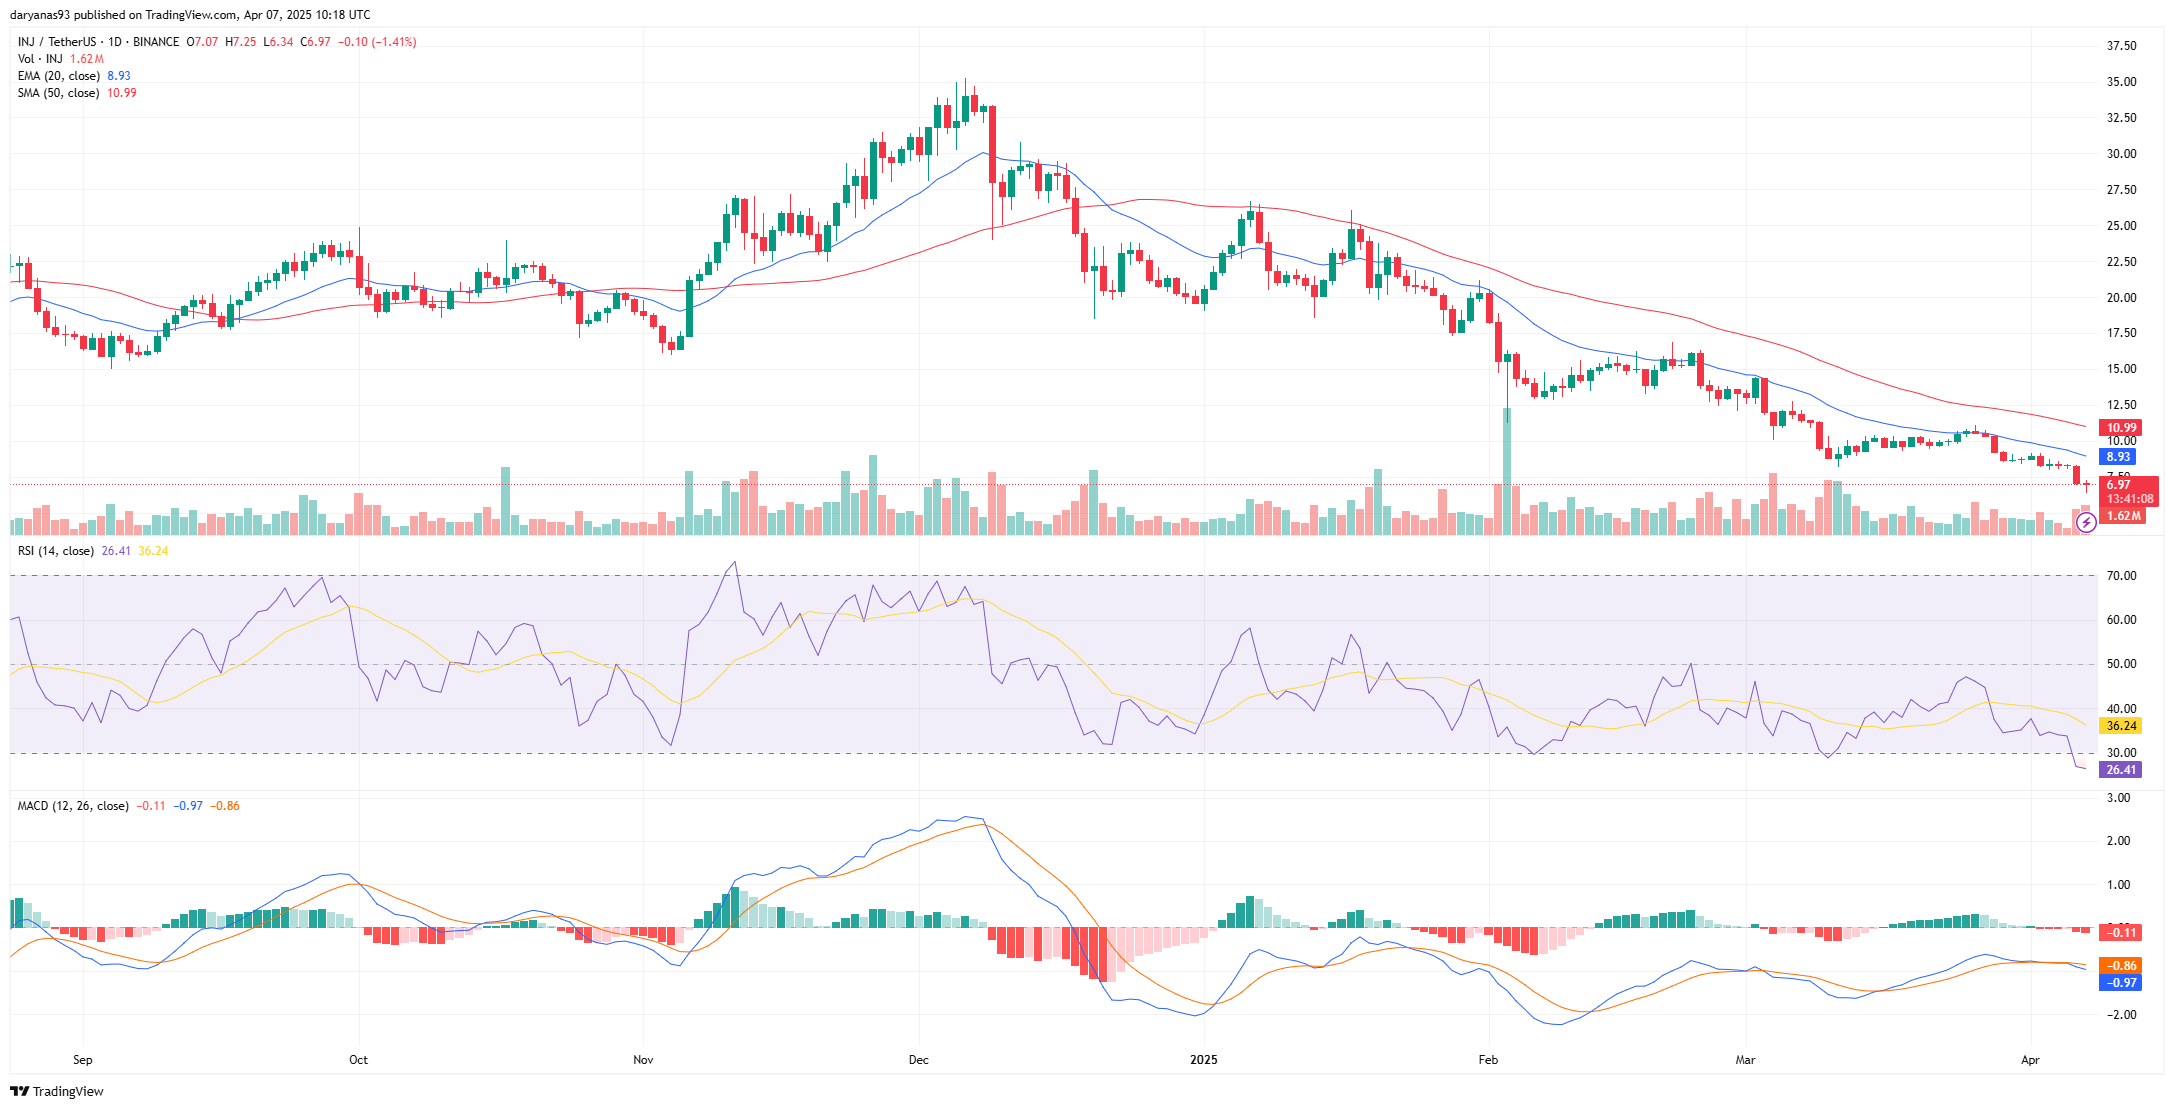
Despite a series of major initiatives in the first quarter of this year, Injective has seen its price continue to trend downward, now sitting in the deep oversold zone. While this signals the possibility of a short-term bounce, the overall market sentiment remains bearish.
This year, Injective (INJ) has made a slew of major announcements and launched several big initiatives.
On January 29, Injective Labs announced plans to launch native Ethereum Virtual Machine support on its Layer 1 blockchain. On Jan. 30, the project launched an AI Index, which combines 10 largest AI tokens as well as traditional equities, including TAO, FET, NVDA and PLTR, into one on-chain asset.
In mid-February, it also launched TradFi Stocks index, which tracks some of the world’s largest publicly traded companies, including Amazon, Apple, Microsoft, and Goldman Sachs.
On Feb. 27, Injective announced that the German telecommunications company Deutsche Telekom had joined it as a validator. Google followed suit, joining Injective as a validator in late March.
Despite all these developments, INJ price has been on a clear downtrend, which picked up momentum in late December last year, when the 20-day Exponential Moving Average crossed below the 50-day Simple Moving Average. A short-lived bullish breakout attempt emerged in early and mid January, with price briefly climbing above the 20 EMA and nearly testing the 50 SMA.

Most recently, INJ price action broke down through the $8.10–$8.50 support zone, which had been holding for about a month. It currently trades at $6.93, down by 15% in the past 24 hours.
The Relative Strength Index also plunged into the deep oversold zone, sitting 26.41 at press time.
The Moving Average Convergence/Divergence indicator is currently bearish, as the MACD line is below the signal line with red histogram bars indicating negative momentum. However, the lines are converging, suggesting weakening bearish pressure.
While the oversold RSI and MACD suggest the possibility of short-term relief bounces, the overall structure remains firmly bearish. With the $8.10–$8.50 support zone breached, the next key support lies in the $5.50 region — a level that was tested during May-June 2023. If the bearish momentum continues, this area could act as the next support.


