Cardano price is slowly forming a popular bullish pattern, pointing to a strong bullish breakout in the next few months or weeks.
Cardano (ADA), a popular proof-of-stake coin, remains in a bear market after plunging by almost 50% from its highest level in November.
However, some on-chain data and technical indicators point to a strong bullish breakout in the coming weeks or months.
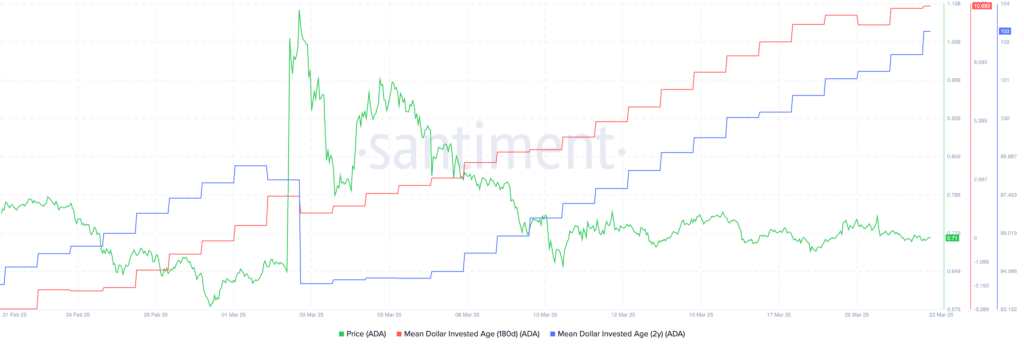
Santiment data shows that the Mean Dollar Invested Age, or MDIA has continued rising in the past few months. The 180-day MDIA indicator has jumped to 10.68, up from minus 3.2 in February.
Similarly, the 2-year MDIA indicator has jumped to 103, up from the year-to-date low of 94. This is a popular indicator that has historically accompanied major rebounds. It tracks the average age of each dollar invested into a coin.

Specifically, the indicator looks at whether older and stagnant wallets circulate their tokens into the market. A rising MDIA indicator is often seen as a bullish sign, while a dropping one shows that they are selling their coins.
Cardano, like other cryptocurrencies, has dropped in the past few months. This decline is partly because of profit-taking by some traders after its strong performance in the fourth quarter.
It is also because of the ongoing fear of President Donald Trump’s tariffs.
Cardano price technical analysis

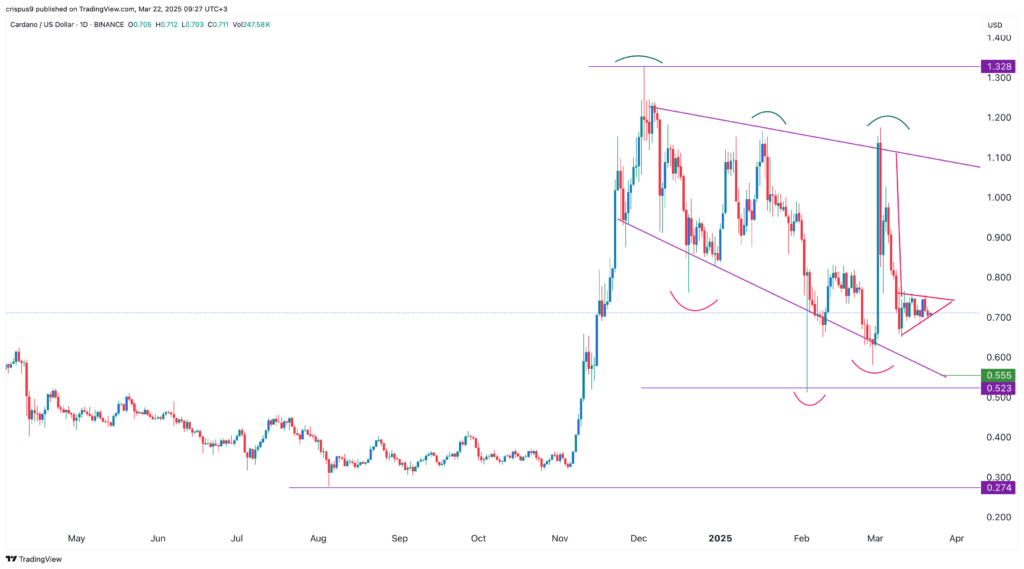
The daily chart shows that the ADA price has been in a slow downtrend in the past few months. It has dropped from a high of $1.328 in December to $0.70 as it formed a series of lower lows and lower highs.
Most recently, the coin has formed a bearish pennant pattern comprising a vertical line and a symmetrical triangle. This pattern usually leads to a strong bearish breakdown.
On the positive side, the coin has been forming a falling broadening wedge pattern. This pattern comprises two descending and broadening trendlines.
In most cases, it often leads to a strong bullish breakout.
Therefore, the most likely scenario is where the bearish pennant triggers a drop to the wedge’s lower side at $0.555 and then resumes the uptrend. A rebound may see it rise to the psychological point at $1, followed by last year’s high of $1.32, up by 90% from the current level.


