Bitcoin is in continuous downtrend since the start of the week, that is Monday (24 February 2025). The president of the USA, Donald Trump, imposed a Tariff that built a lot of selling pressure on the major cryptocurrency. Bitcoin breaks the $90,000 major support area and there is a cascade of liquidations.

The dump below $90,000 hit the long positions pretty hard and more than 93% of the long positions are wiped from the market. Futures trading gives traders leverage to open big positions with small margin, but comes with high risk of liquidation.
Let’s see what’s on the chart and how the technical moves in the coming days.
Bitcoin Technical Analysis
Price broke the major support of $89,000-$90,000 area on the daily time frame and printing big red candles. BTC also broke the 200 Daily Moving Average (DMA) which is around $82,000 and now trading below it. The 200 DMA is a crucial support level in the bull market and the price needs to reclaim this level to remain bullish on higher time frames.
If Bitcoin broke below the 200 DMA, then we may see a potential drop to the lower support of $71,300-$73,700 area. There is a CME gap around $77,400, which is likely to be filled as 90% of the CME gaps are filled by Bitcoin in the past.
The higher timeframes are still bullish and Bitcoin’s recent dump is not new in bull markets. As per BTC history, there is more than 30% drop from the local top in bull markets. Traders are optimistic that this is just a correction before the big bull run ahead. The next couple of days will set the stage and will give more confirmation about the next move of BTC.
Bitcoin Next Stop: $72,000 or $90,000
The only question on traders’ lips is what comes first for BTC: Dump to $72,000 or a pump to $90,000?
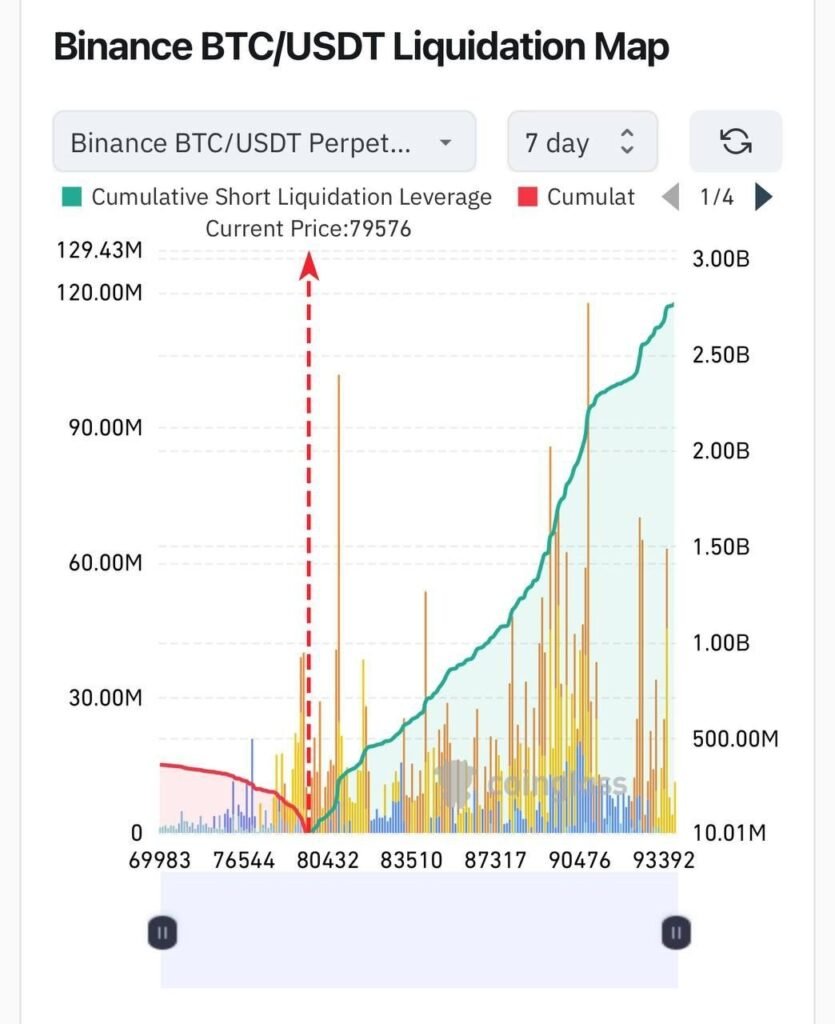
The answer to this question is that we may see a bounce towards $90,000 as the market is in continuous downtrend without bounce, and there is a lot of short positions building, and we may see a short squeeze to liquidate those high leverage positions.

The above image shows the Binance Bitcoin liquidation map and you can clearly see that there is very low liquidity downside while a lot of liquidity is sitting in the upside. You can accumulate some Bitcoin and other altcoins in the dip as big institutions are buying and staking. The shakeout may happen to liquidate and hunt stop losses, but these are considered as healthy.
Let’s see how Bitcoin starts the next month and we see some good moves in the coming months.


