
BNB price climbed higher this week as bulls attempted to confirm a breakout from a bullish double bottom pattern forming on the weekly chart.
Summary
- BNB price climbed toward the $680 neckline of a bullish double bottom pattern, with a breakout potentially opening the door for a rally toward $800.
- Market sentiment improved amid speculation surrounding spot BNB ETF applications from Grayscale and VanEck, alongside growing institutional access through Teucrium’s XBNB ETF.
- Expanding Real-World Asset integrations on BNB Chain, including BlackRock’s BUIDL and Franklin Templeton’s BENJI via Securitize, strengthened the network’s long-term utility narrative.
According to data from crypto.news, BNB (BNB) price rose over 2% over the past week to trade near $679 at press time, pushing its market capitalization above $96 billion. The token has now recovered sharply from its April lows near $580 as investor sentiment around the Binance ecosystem improved.
BNB’s latest rally appears to have been driven by a combination of institutional and ecosystem-related catalysts unique to the token. Market speculation surrounding pending spot BNB ETF applications from major asset managers such as Grayscale and VanEck has fueled optimism that the token could attract broader institutional participation if approved.
Investor sentiment also strengthened following the successful tracking performance of the recently launched Teucrium 2x Long Daily BNB ETF (XBNB), which expanded institutional wrapper access to BNB and increased exposure opportunities for traditional market participants.
At the same time, growing RWA adoption on the BNB Chain has further reinforced the network’s long-term utility narrative. Recent integrations involving BlackRock’s BUIDL and Franklin Templeton’s BENJI through Securitize have strengthened expectations that the chain could play a larger role in tokenized finance infrastructure.
On the weekly chart, BNB appears to have formed a bullish double bottom pattern over the past several months, with two major lows established around the $580 region. The neckline of the pattern sits near the $680 resistance zone, which the token is currently attempting to reclaim.
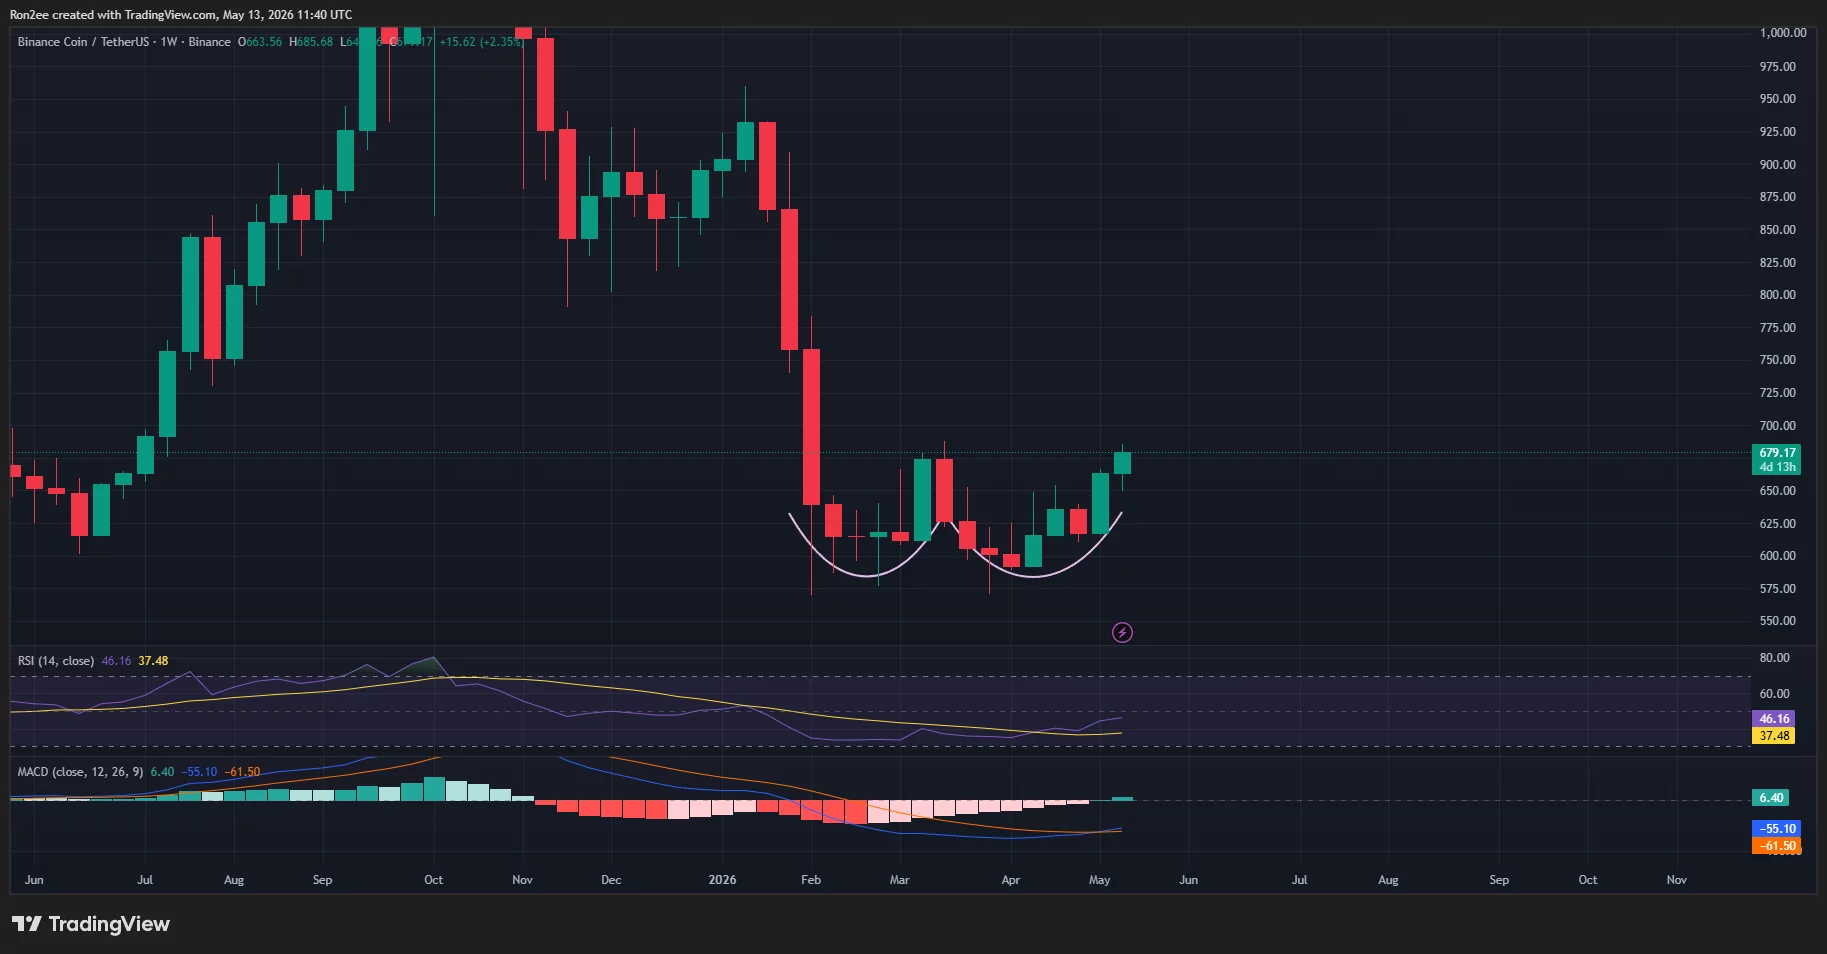
Typically, a confirmed breakout above the neckline of a double bottom pattern signals a potential trend reversal and often opens the door for a rally equal to the height of the formation. Based on the current structure, a successful breakout above $680 could position BNB for a move toward the $780–$800 region in the coming months.
A look at other technical indicators also supports the improving bullish outlook. The MACD histogram has started turning positive after weeks of fading bearish momentum, while the MACD line appears to be curling upward toward a bullish crossover. This suggests that buying momentum may gradually be returning.
Meanwhile, the RSI has also rebounded from oversold territory and currently sits near the neutral 46 level, indicating that BNB still has room for additional upside before entering overbought conditions.
The recent recovery is also notable because BNB had been under pressure in recent months amid renewed scrutiny surrounding Binance’s compliance operations in the U.S. That uncertainty contributed to weaker sentiment earlier this year, though price action now suggests sellers may be losing control near the $580 support zone.
For now, the key resistance level remains near $680, which serves as the neckline of the double bottom formation. A decisive weekly close above that area could strengthen the bullish case and increase the chances of a move past the key $700 psychological level.
On the downside, the $650 and $600 regions remain important support zones that bulls will likely need to defend to maintain the current recovery structure.
Disclosure: This article does not represent investment advice. The content and materials featured on this page are for educational purposes only.

