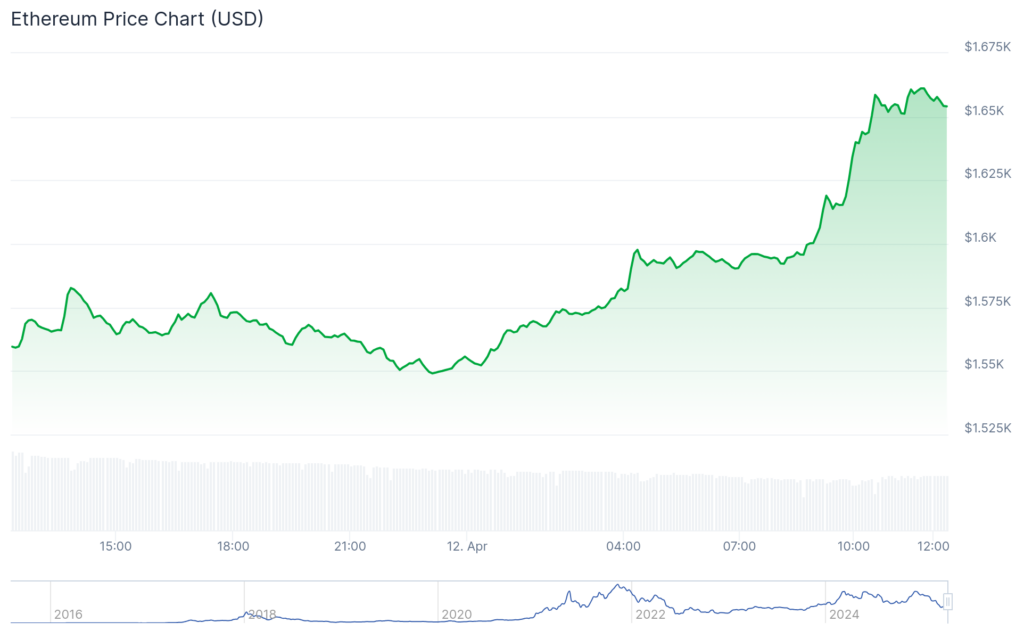
Spot Ethereum exchange-traded funds continued shedding assets as US recession risks rose and its price crashed.
SoSoValue data shows that spot Ethereum (ETH) ETFs shed assets in the last seven consecutive weeks. They had net outflows of $82.4 million last week, bringing the cumulative inflows to $2.2 billion.
All ETH ETFs now have just $5.25 billion in assets, with BlackRock’s ETHA and Grayscale’s ETHE leading with $1.85 billion each. Grayscale’s mini fund ETH follows with $711 million, while Fidelity’s FETH has $580 million.
In contrast, spot Bitcoin ETFs are doing better, with their cumulative outflows at over $35 billion and total assets at $93 billion.
Ethereum ETFs have shed assets because of its performance. The price of ETH has dropped by almost 62% from its highest point in November last year to the current $1,655.

Unlike Bitcoin (BTC), which surged to a new all-time high this year, Ethereum has remained significantly lower than its all-time high of $4,872. Worse, $1000 invested in Ethereum on the same day in 2022 would now be worth $745, while a similar amount allocated to Bitcoin would be $1,400.
Ethereum has faced several challenges in the past. The most important one is that it has faced substantial competition from layer-1 and layer-2 networks. Some of the most notable competition is from Solana (SOL), Base, Tron (TRX), and Arbitrum (ARB).
This competition means that Ethereum is no longer the most profitable chain in the crypto industry. Data shows that other popular chains and apps like Uniswap, Jito, and Solana have passed it this year.
Ethereum price technical analysis

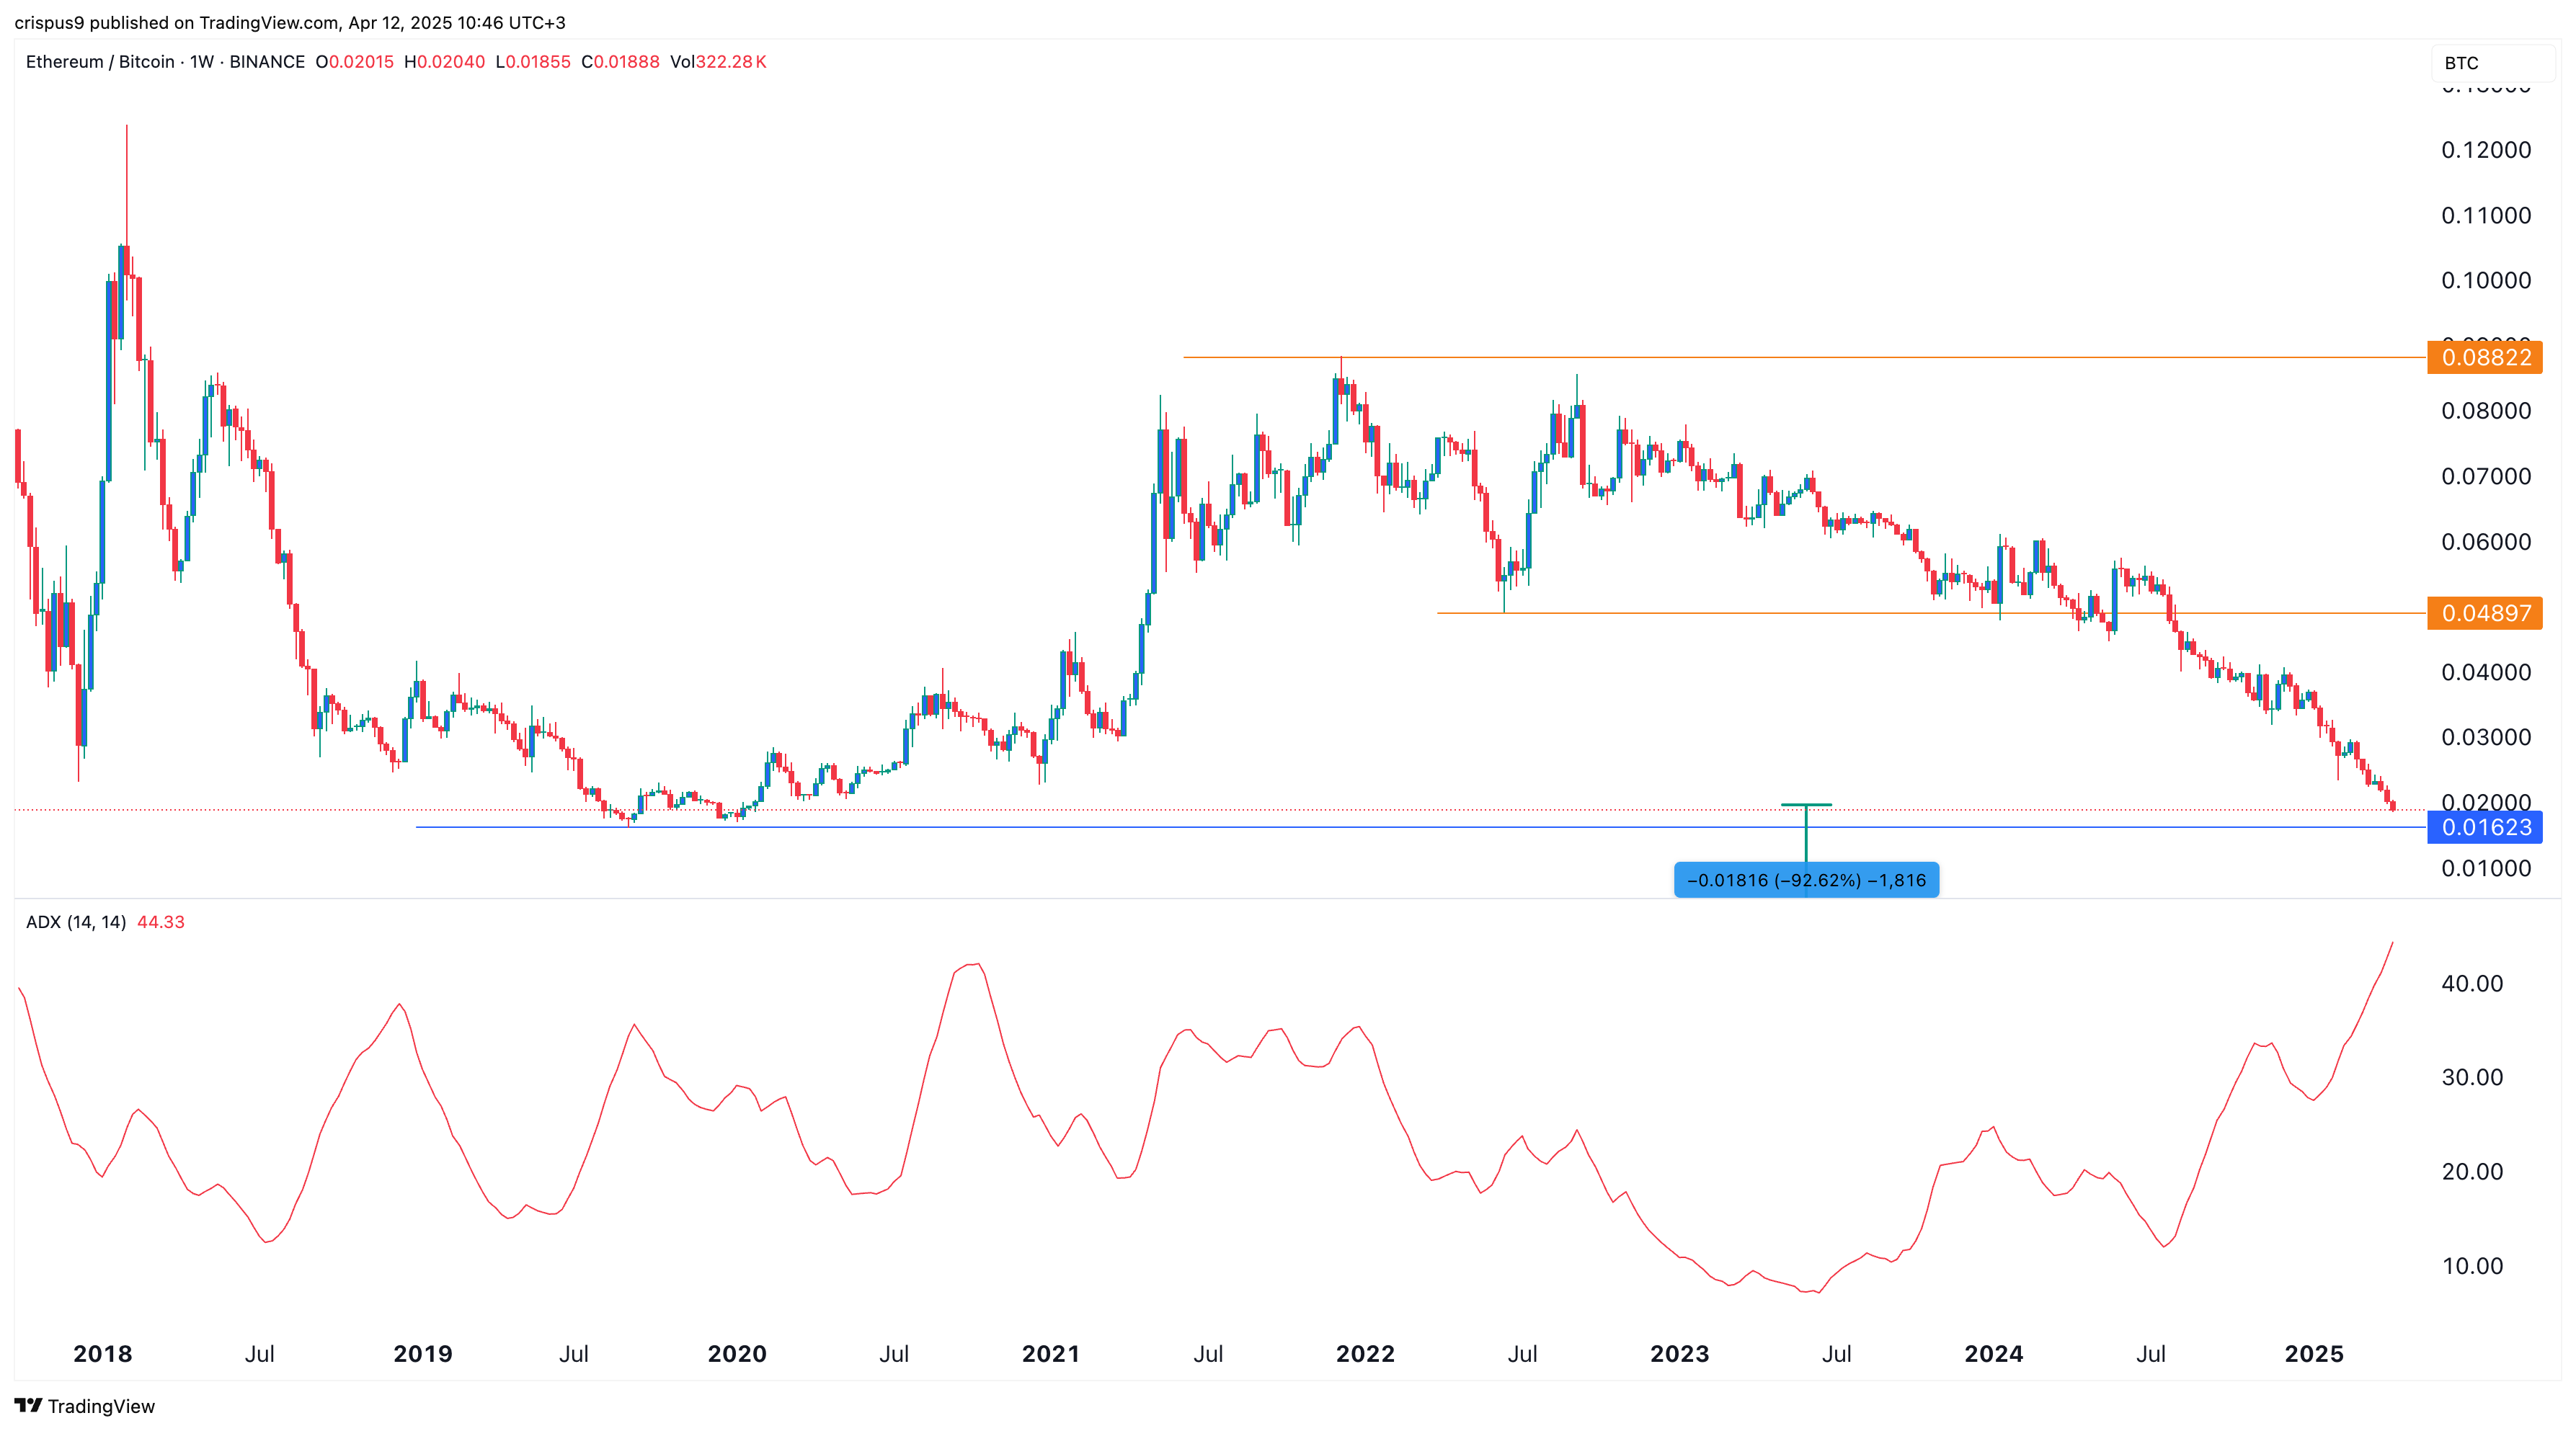
While the ETH price in USD terms looks bad, the ETH/BTC one is worse. The weekly chart above shows that the ETH/BTC pair has been in a strong downtrend, moving from 0.088 in 2021 to 0.0188 today. It has crashed to the lowest point in five years as Ethereum’s dominance has faded.
The pair remains much lower than all moving averages, while the Average Directional Index has surged to 44. The ADX is a popular indicator used to measure the strength of a trend.
Therefore, the pair will likely continue plunging as sellers target the key support at 0.016, its lowest level in September 2019, down by 92% from the current level.


